Comment

40 ticks potential profit in 37 seconds on 6 June 2024, analysis on futures forex fx news trading natural gas on DOE Natural Gas Storage Report data

According to our analysis natural gas moved 40 ticks on DOE Natural Gas Storage Report data on 6 June 2024.

Natural gas (40 ticks)

Charts are exported from JForex (Dukascopy).


Weekly Update on U.S. Natural Gas Storage: Trends and Insights as of May 31, 2024

As we close another week, the U.S. Energy Information Administration (EIA) has released its latest Natural Gas Storage Report. This week's data, ending on May 31, 2024, reveals significant trends in the storage of working gas, reflecting both seasonal influences and broader market dynamics.

Current Storage Figures and Regional Breakdown

As of May 31, total working gas in underground storage across the Lower 48 states stood at 2,893 billion cubic feet (Bcf). This is a robust increase of 98 Bcf from the previous week. When we delve into regional data, the distribution and changes become even more insightful:

  • East: Stocks reached 575 Bcf, with an impressive weekly increase of 37 Bcf.

  • Midwest: Storage levels rose to 681 Bcf, marking a rise of 29 Bcf over the last week.

  • Mountain: Smaller but still significant, stocks are at 218 Bcf, up 8 Bcf.

  • Pacific: Recorded a modest rise of 6 Bcf to reach 273 Bcf.

  • South Central: Demonstrating the largest regional storage, totals hit 1,146 Bcf, with an increase of 18 Bcf.

These figures underscore a noteworthy increase in storage levels across most regions, particularly in areas like the Pacific and Mountain regions, where percentage increases far outpace other regions.

Historical Comparisons and Market Implications

The current total storage of 2,893 Bcf not only surpasses last week's figures but also shows significant gains over historical benchmarks. This total is 373 Bcf higher than the same time last year and 581 Bcf above the five-year average of 2,312 Bcf. Such a position above the historical average suggests a robust supply scenario which could influence market sentiments and pricing strategies in the natural gas markets.

  • Year-over-Year: Each region has shown growth compared to last year, with the Mountain and Pacific regions reporting the most substantial relative increases (62.7% and 70.6%, respectively).

  • Against the Five-Year Average: Here too, the Mountain and Pacific regions standout with increases of 67.7% and 21.3%, respectively, showcasing a trend of growing stockpiles that may impact future supply availability and pricing.

Statistical Considerations

The EIA report also touches on the accuracy and reliability of these figures. The coefficients of variation (CV) for stocks indicate the reliability of the reported quantities. For most regions, the CV remains low, suggesting a high level of confidence in these measurements. Particularly notable is the Pacific region's 0.0% CV, indicating highly reliable data.

Market Outlook

Given the current data, market participants might anticipate stable or potentially lower natural gas prices, barring any unforeseen shifts in market demand or supply disruptions. The significant increase above the five-year average provides a cushion that could help mitigate price volatility in the short term.

In conclusion, the latest report on natural gas storage indicates a healthy supply situation in the U.S. As we head into the summer months, where consumption typically rises, the industry appears well-prepared to meet demand. However, stakeholders should continue to monitor weekly trends and other market indicators to refine their strategies in this dynamic market environment.

Source: https://ir.eia.gov/ngs/ngs.html


Start futures forex fx commodity news trading with Haawks G4A low latency machine-readable data, one of the fastest data feeds for DOE data.

Please let us know your feedback. If you are interested in timestamps, please send us an email to sales@haawks.com.

Comment

355 pips potential forex fx futures news trading profit from 9 events in May 2024 with Haawks G4A machine-readable data feed

Comment

355 pips potential forex fx futures news trading profit from 9 events in May 2024 with Haawks G4A machine-readable data feed

According to our analysis there was a potential of 355 pips / ticks profit out of the following 9 events in May 2024. The potential performance in 2023 was 13,607 pips / ticks.

May 2024

Cumulative potential, indicative performance May 2024, please see all releases below.

Total trading time would have been around 5 minutes! (preparation time not included)


Analyzing May 2024's Economic Reports: Impacts and Insights

In May 2024, several significant economic reports released by U.S. agencies and other entities have made waves across the financial markets, reflecting the ongoing fluctuations and trends in the economy. Here’s a detailed look at some of the key reports and their impacts on trading activities:

1. US BLS Employment Situation (Non-farm payrolls/NFP) - May 3, 2024

The Non-farm Payrolls (NFP) reported a movement of 77 pips, indicating a volatile reaction from the markets. This data, crucial for understanding employment trends excluding farm workers and a few other job categories, often serves as a barometer for overall economic health. A higher or lower than expected number can indicate the pace at which the economy is either adding or losing jobs, influencing Federal Reserve policy decisions.

2. DOE Natural Gas Storage Report - May 9, 2024

This weekly report showed a movement of 23 ticks. Natural gas storage levels can significantly affect natural gas prices, influencing energy stocks and sectors related to utilities and manufacturing that are heavy energy consumers.

3. US BLS Producer Price Index (PPI) - May 14, 2024

The Producer Price Index, which measures the average change over time in the selling prices received by domestic producers for their output, moved by 12 pips. This lesser movement suggests a relatively stable perception of producer inflation, which can preempt consumer inflation trends.

4. US Retail Sales and US BLS Consumer Price Index (CPI) - May 15, 2024

A significant movement of 104 pips was observed, underscoring the importance of these metrics. Retail sales directly reflect consumer spending health, while CPI is a direct measure of consumer inflation. Together, they provide a comprehensive picture of the economic backdrop, influencing monetary policy and investor sentiment.

5. DOE Petroleum Status Report - May 15, 2024

Recording a movement of 33 ticks, this report provides insights into the supply-and-demand dynamics of the petroleum market, influencing not only energy prices but also economic expectations globally, given the pivotal role of oil in the world economy.

6. US Philadelphia Federal Reserve Bank Manufacturing Business Outlook Survey - May 16, 2024

The Philly Fed index, moving 17 pips, reflects the health of the manufacturing sector in the Philadelphia Fed's region. It’s a leading indicator of economic health—manufacturers being more responsive to changes in the business cycle.

7. DOE Natural Gas Storage Reports - May 16 & 23, 2024

Further reports on natural gas storage recorded movements of 24 and 45 ticks respectively. These reports reflect adjustments in market strategies and expectations concerning energy consumption and pricing.

8. US BEA Personal Income and Outlays - May 31, 2024

Finally, a 20 pip movement was seen in this report, which details personal income and consumer spending. This data is critical for gauging consumer capability and willingness to spend, directly feeding into expectations on economic growth trajectories.

Conclusion

Each report in May 2024 painted part of a broader economic picture, helping market participants gauge the tempo of economic activity and inflationary pressures. The movements in pips and ticks post-report release indicate the market's sensitivity to economic signals and can guide investors, policymakers, and analysts in making informed decisions. As we move forward, keeping an eye on these indicators will remain crucial in understanding the evolving economic landscape.

Disclaimer: This blog post is for informational purposes only and should not be construed as financial advice. Always conduct thorough research and consider seeking advice from a financial professional before making any investment decisions.


Start futures/forex/oil/grains news trading with Haawks G4A low latency machine-readable data today, we offer one of the fastest machine-readable data feeds for US macro-economic and commodity data and macro-economic data from Norway, Sweden, Turkey, Switzerland and ECB interest rates and statement.

Please let us know your feedback and check out our G4A low latency data feed.

All data is machine readable and available via API access in Aurora, CH1, NY4 and LD4. Free trials.

Comment

Comment

20 pips potential profit in 13 seconds on 31 May 2024, analysis on futures forex fx news trading USDJPY and EURUSD on US BEA Personal Income and Outlays (PIO)

According to our analysis USDJPY and EURUSD moved 20 pips on US BEA Personal Income and Outlays and US Durable Goods Orders data on 31 May 2024.

USDJPY (10 pips)

EURUSD (10 pips)

Charts are exported from JForex (Dukascopy).


Analyzing the Latest Personal Income and Outlays Report for April 2024

The Bureau of Economic Analysis (BEA) recently released the Personal Income and Outlays report for April 2024, revealing significant insights into the current economic trends and consumer behavior. Here's a breakdown of the key findings and what they mean for the economy.

Key Highlights from April 2024

  • Personal Income and Disposable Income: Personal income in April saw a moderate increase of $65.3 billion or 0.3 percent, which aligns with the growth trends observed in recent months. Disposable personal income (DPI), which is what people have left to spend after taxes, also rose by $40.2 billion or 0.2 percent. These figures suggest a steady income flow but also hint at the rising tax burdens consumers are facing.

  • Consumer Spending: Personal consumption expenditures (PCE) increased by $39.1 billion, a growth of 0.2 percent from the previous month. This increase is relatively modest, indicating that while consumers are spending, there is caution in the air possibly due to inflationary pressures.

  • Inflation and Prices: The PCE price index, which measures the average change in prices paid by consumers, increased by 0.3 percent in April. Excluding food and energy, core inflation was slightly lower at 0.2 percent. On an annual basis, the PCE price index has increased by 2.7 percent, and core inflation stands at 2.8 percent. These figures are crucial for the Federal Reserve's monitoring of inflation dynamics.

  • Sector-Specific Insights: The report detailed changes in spending across various sectors. Spending on services rose by $49.1 billion, led by increases in housing, healthcare, and financial services. However, there was a $10.0 billion decline in goods spending, driven by decreases in recreational goods and vehicles.

  • Savings and Outlays: The personal saving rate was recorded at 3.6 percent, indicating that consumers are saving a smaller portion of their income compared to previous periods. Total personal outlays, which include spending and other payments like interest and transfers, grew by $42.8 billion.

Economic Implications

The moderate growth in personal income and consumption, combined with stable inflation rates, suggests that the economy is on a steady path, albeit with underlying caution among consumers. The disparities in spending between goods and services highlight shifting consumer preferences, possibly influenced by long-term changes brought about by the pandemic and current economic policies.

Inflation remains a critical watchpoint. While the core inflation rate is stable, continued increases in energy prices and certain service sectors could prompt a reevaluation of spending and saving strategies among consumers.

Forward Look

As we move deeper into 2024, the interplay between income growth, inflation, and consumer spending will be pivotal in shaping economic policies and consumer confidence. The next release of this report, scheduled for June 28, 2024, will be crucial for understanding if these trends are merely a blip or the beginning of a more significant shift in the economic landscape.

Overall, while the economy shows signs of resilience, the balance between spending and saving, alongside inflation management, will dictate the pace of economic recovery and growth in the coming months.

Source: https://www.bea.gov/news/2024/personal-income-and-outlays-april-2024


Start futures #forex fx news #trading with Haawks G4A low latency machine-readable data today, one of the fastest news data feeds for US economic and commodity data.

Please let us know your feedback. If you are interested in timestamps, please send us an email to sales@haawks.com.

Comment

Comment

45 ticks potential profit in 16 seconds on 23 May 2024, analysis on futures forex fx news trading natural gas on DOE Natural Gas Storage Report data

According to our analysis natural gas moved 45 ticks on DOE Natural Gas Storage Report data on 23 May 2024.

Natural gas (45 ticks)

Charts are exported from JForex (Dukascopy).


Weekly Natural Gas Storage Update: Significant Inventory Growth

The latest data from the U.S. Energy Information Administration (EIA) for the week ending May 17, 2024, reveals a substantial increase in natural gas stocks, indicating strong trends in gas storage across the United States. Here's an insightful overview of the key findings from the report released on May 23, 2024.

Overview of Natural Gas Stocks

As of May 17, 2024, working gas in underground storage totaled 2,711 billion cubic feet (Bcf), marking a significant net increase of 78 Bcf from the previous week. This current stock is not only 402 Bcf higher than the same time last year but also 606 Bcf above the five-year average, which sits at 2,105 Bcf. These figures suggest a robust storage scenario that exceeds historical norms.

Regional Insights

The distribution of storage increases across the different regions is as follows:

  • East: Storage rose to 511 Bcf, up by 29 Bcf, reflecting a 6.5% increase from last year and a 28.1% surge over the five-year average.

  • Midwest: Here, stocks reached 628 Bcf, with a 22 Bcf increase from the previous week. This represents a 16.5% increase year-over-year and a 33.6% jump from the five-year average.

  • Mountain: Stocks stood at 202 Bcf, up 6 Bcf for the week, and showing the most significant percentage increase—71.2% from last year and 74.1% over the five-year average.

  • Pacific: Increased by 7 Bcf to 259 Bcf, up a dramatic 90.4% from last year and 27% from the five-year average.

  • South Central: The largest regional storage, tallying at 1,112 Bcf after a 15 Bcf increase, with a 7.2% rise from last year and 21.3% above the five-year average.

These figures point to a growing trend in natural gas storage, reflecting potential shifts in both market dynamics and consumption patterns.

Statistical Confidence

The EIA report also provides estimated measures of sampling variability. Notably, the coefficients of variation for stocks in regions like the East and Midwest are relatively low, indicating high confidence in these measurements. Specifically, the total coefficient of variation stands at 0.4%, demonstrating the robustness of the overall data.

Market Implications

This notable increase in gas stocks might influence natural gas prices and market strategies. Higher storage levels typically translate into more stable prices, but the current levels surpassing the five-year averages substantially could hint at potential downward pressures on natural gas prices in the short term.

Looking Ahead

As the storage levels continue to climb, market participants will be closely monitoring the trends for implications on supply and pricing. The next update, scheduled for release on May 30, 2024, will be eagerly awaited for further insights into the trajectory of natural gas storage and its broader economic impacts.

In summary, the natural gas storage report highlights a robust increase in stocks, well above year-ago and five-year average levels, signaling strong supply conditions and potential shifts in the energy market landscape. Stay tuned for further updates as the situation evolves.

Source: https://ir.eia.gov/ngs/ngs.html


Start futures forex fx commodity news trading with Haawks G4A low latency machine-readable data, one of the fastest data feeds for DOE data.

Please let us know your feedback. If you are interested in timestamps, please send us an email to sales@haawks.com.

Comment

Comment

24 ticks potential profit in 31 seconds on 16 May 2024, analysis on futures forex fx news trading natural gas on DOE Natural Gas Storage Report data

According to our analysis natural gas moved 24 ticks on DOE Natural Gas Storage Report data on 16 May 2024.

Natural gas (24 ticks)

Charts are exported from JForex (Dukascopy).


Navigating the Surge in Natural Gas Storage: Analysis of the Latest EIA Weekly Report

As of May 10, 2024, the Energy Information Administration (EIA) has released its latest Weekly Natural Gas Storage Report, marking a notable increase in natural gas inventories. Here's a comprehensive breakdown of the data and what it implies for the market and policy-making.

Overview of Current Gas Stocks

The total working gas in underground storage across the Lower 48 states stood at 2,633 billion cubic feet (Bcf), as per the latest EIA estimates. This figure represents an increase of 70 Bcf over the previous week. When compared to the same week last year and against the five-year average, the current stocks are substantially higher—421 Bcf and 620 Bcf respectively. Such a significant increase not only highlights a robust replenishment but also sets a new precedent above the historical five-year range.

Regional Insights

  • East: Stocks rose to 482 Bcf, up by 28 Bcf from the previous week. This is significantly higher compared to both last year's and the five-year average figures.

  • Midwest: Here, inventories have seen an increase to 606 Bcf, up 22 Bcf week-over-week, with a notable 35.9% increase over the five-year average.

  • Mountain: This region’s stocks are at 196 Bcf, a modest increase but nearly double the five-year average, signaling unusual stockpiling activity.

  • Pacific: Reported at 252 Bcf, the stocks have surpassed last year’s numbers by a staggering 104.9%.

  • South Central: Totaling 1,097 Bcf, with a nuanced detail between salt (313 Bcf) and nonsalt (784 Bcf) facilities showing a diverse storage strategy.

Implications for the Market

The significant surplus relative to historical averages suggests several market dynamics. Firstly, it may indicate lesser demand due to mild weather conditions or increased efficiency in energy use. Alternatively, it might reflect a strategic buildup in anticipation of higher future demand or as a hedge against geopolitical uncertainties affecting supply lines.

The regional data provide deeper insights; for instance, the extraordinary increase in the Pacific and Mountain regions might be driven by specific local factors or infrastructural developments. Investors and analysts would do well to watch these trends for indications of regional demand shifts or supply chain bottlenecks.

Policy and Economic Impacts

From a policy standpoint, the current levels of gas storage offer a buffer that can help manage price stability and energy security. However, such high levels might also dampen prices, potentially impacting producers' profitability and future investment in gas exploration and production. Regulators and policymakers must balance these aspects to optimize national energy strategies.

Forward Outlook

Looking ahead, market participants and regulators will need to keep a close eye on upcoming weekly reports and other market indicators to gauge the trend's sustainability. The next report, due on May 23, 2024, will be particularly scrutinized to see if the trend of stock buildups continues or stabilizes.

In conclusion, while the current high storage levels suggest a strong supply situation, the implications for prices, market dynamics, and policy-making are complex and must be navigated with careful analysis and foresight.

Source: https://ir.eia.gov/ngs/ngs.html


Start futures forex fx commodity news trading with Haawks G4A low latency machine-readable data, one of the fastest data feeds for DOE data.

Please let us know your feedback. If you are interested in timestamps, please send us an email to sales@haawks.com.

Comment

Comment

17 pips potential profit in 15 seconds on 16 May 2024, analysis on futures forex fx low latency news trading USDJPY and EURUSD on US Philadelphia Fed Manufacturing data

According to our analysis USDJPY and EURUSD moved 17 pips on US Philadelphia Federal Reserve Bank Manufacturing Business Outlook Survey data on 16 May 2024.

USDJPY (12 pips)

EURUSD (5 pips)

Charts are exported from JForex (Dukascopy).


May 2024 Manufacturing Business Outlook: A Mix of Decline and Optimism

The results from the May 2024 Manufacturing Business Outlook Survey indicate a mixed bag for the regional manufacturing sector, presenting a scenario where current conditions have softened, yet future prospects remain positive. Conducted between May 6 and May 13, the survey captures the opinions of regional manufacturing firms, revealing a slight weakening in present activities but a sustained expectation of growth in the months ahead.

Current Manufacturing Climate: Challenges on Multiple Fronts

The survey underscores a noticeable decline in several key indicators this month. The diffusion index for current general activity, while still positive, has dropped 11 points to 4.5, primarily reversing the gains observed last month. This downward trend is also reflected in the new orders and shipments indexes, both of which have dipped into negative territory for the first time since early this year; new orders fell from 12.2 to -7.9, and shipments dropped from 19.1 to -1.2.

In terms of employment, the indicators are somewhat conflicting. Although the employment index itself showed a slight improvement, rising 3 points to -7.9, the overall balance still points to a decline in employment. A significant portion of firms (20%) reported a decrease in employment levels, overshadowing the 12% that noted an increase.

Pricing Trends: Increases Continue but Below Long-Term Averages

Price pressures continue to be a notable concern, albeit remaining below historical averages. The prices paid index decreased slightly by 4 points to 18.7, indicating ongoing rises in input costs. Conversely, the prices received index for firms’ own goods nudged up by just 1 point to 6.6, suggesting a more moderate pass-through of costs to consumers.

Future Outlook: Optimism Prevails Despite Current Downturn

Despite the current downturn, the survey reveals an overarching sense of optimism among firms about the future. The future general activity index experienced a minor decline but remained robust at 32.4, suggesting that a significant number of firms (45%) expect increases in activity over the next six months. This sentiment is bolstered by positive movements in the indexes for future new orders and shipments, with particularly strong expectations for the latter, which climbed 17 points to 46.2.

Employment prospects also appear more hopeful, as reflected by the 9-point rise in the future employment index to 21.7. This signals that firms are generally anticipating the need for more hands on deck as business activities are expected to ramp up.

Special Focus: Inflation Expectations and Price Forecasts

This month’s survey included special questions about price forecasts, revealing that firms expect a steady rise in their own prices by about 3.0% over the next year, mirroring the expected rate of inflation for U.S. consumers. While these projections hold steady from previous forecasts, there’s a slight downtrend in the expected rise in employee compensation, suggesting cautious optimism about cost management.

Conclusion

The May Manufacturing Business Outlook Survey paints a realistic picture of the current manufacturing landscape—while immediate conditions show signs of softening, particularly in new orders and shipments, the broader outlook remains positive. This resilience amidst challenges highlights the sector's adaptability and forward-looking nature, suggesting that firms are poised to navigate through current uncertainties with a focus on future growth opportunities.

Source: https://www.philadelphiafed.org/surveys-and-data/regional-economic-analysis/mbos-2024-05


Start futures forex fx news trading with Haawks G4A low latency machine-readable data, one of the fastest machine-readable news trading feeds for US macro-economic and commodity data.

Please let us know your feedback. If you are interested in timestamps, please send us an email to sales@haawks.com.

Comment

Comment

33 ticks potential profit in 29 seconds on 15 May 2024, analysis on futures forex fx low latency news trading crude oil on DOE Petroleum Status Report data

According to our analysis crude oil moved 33 ticks on DOE Petroleum Status Report data on 15 May 2024.

Light sweet crude oil (17 ticks)

Brent crude oil (16 ticks)

Charts are exported from JForex (Dukascopy).


Analyzing the Latest Trends in U.S. Petroleum Data as of May 2024

The latest Weekly Petroleum Status Report from the U.S. Energy Information Administration provides key insights into the petroleum market for the week ending May 10, 2024. As energy markets fluctuate, this data is crucial for understanding the current state of supply, demand, and pricing within the sector.

Refinery Inputs and Capacity Utilization

U.S. crude oil refinery inputs showed a significant increase, averaging 16.3 million barrels per day, up by 307,000 barrels from the previous week. This indicates a robust demand for refining capacity, which operated at an impressive 90.4% of its total available capacity. This high utilization rate suggests that refineries are ramping up operations possibly in response to anticipated demand or attractive margins on refined products.

Production Increases

Both gasoline and distillate fuel production saw increases last week. Gasoline production rose to an average of 9.7 million barrels per day, while distillate fuel production, which includes diesel and heating oil, also increased to 4.8 million barrels per day. These increases are indicative of refineries adjusting outputs to meet shifting market demands or to replenish inventories.

Import and Inventory Shifts

Interestingly, U.S. crude oil imports averaged 6.7 million barrels per day last week, marking a decrease of 226,000 barrels per day compared to the previous week. Over the last four weeks, however, imports have shown an overall increase of 7.1% compared to the same period last year. This rise could be attributed to various factors including pricing arbitrage opportunities or efforts to bolster reserves.

U.S. commercial crude oil inventories decreased by 2.5 million barrels, underscoring a drawdown that positions current stocks about 4% below the five-year average for this time of year. This reduction in crude inventories could be a sign of stronger demand or a strategic inventory management by market participants.

Fuel Stock and Prices

While total motor gasoline inventories slightly declined, distillate fuel inventories experienced a slight decrease, staying about 7% below the five-year average. This lower inventory level for distillates might signal tightness in the diesel market, possibly leading to higher future prices if the trend continues.

Propane/propylene inventories increased by 2.9 million barrels and are notably 14% above the five-year average. This could be due to lower demand or increased production, leading to higher stocks.

Price Movements

The price for West Texas Intermediate crude settled at $79.81 per barrel, marking a modest increase from the previous week and a significant rise compared to last year. Retail gasoline prices have seen a decline from last week, although they remain slightly higher than the previous year's figures. This could reflect the recent changes in crude prices and refinery outputs.

Conclusion

The data from the week ending May 10, 2024, highlights several important trends in the U.S. petroleum market. Increased refinery output and capacity utilization coupled with fluctuating imports and inventories suggest a dynamic market adjusting to both domestic and international pressures. Prices are reflecting these shifts, with notable implications for consumers and businesses alike. As the market continues to evolve, it will be important to monitor these trends for a deeper understanding of the broader economic landscape influenced by energy commodities.

Source: https://www.eia.gov/petroleum/supply/weekly/pdf/highlights.pdf


Start futures forex fx crude oil news trading with Haawks G4A low latency machine-readable data, one of the fastest data feeds for DOE Petroleum Status Report data.

Please let us know your feedback. If you are interested in timestamps, please send us an email to sales@haawks.com.

Comment

Comment

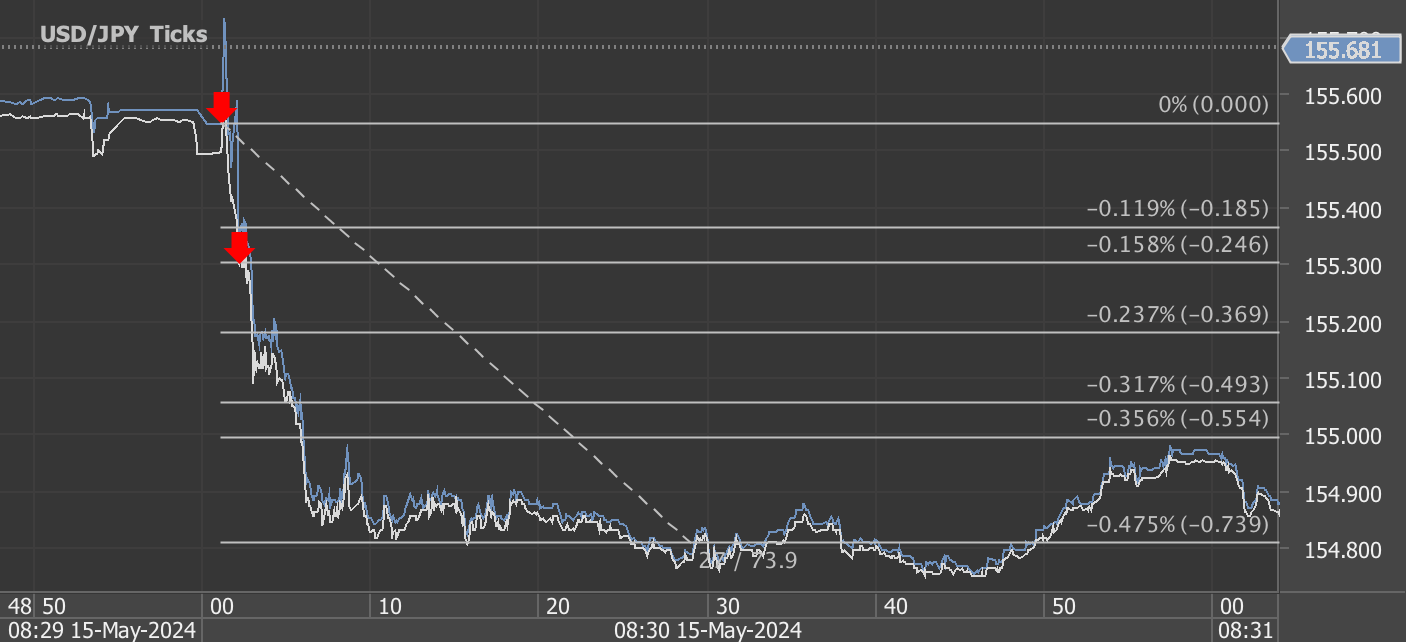
104 pips potential profit in 33 seconds on 15 May 2024, analysis on futures forex fx news trading USDJPY and EURUSD on US Retail Sales and US BLS CPI data

According to our analysis USDJPY and EURUSD moved 104 pips on US Retail Sales and US BLS Consumer Price Index (CPI) data on 15 May 2024.

USDJPY (73 pips)

EURUSD (31 pips)

Charts are exported from JForex (Dukascopy).


Understanding the Latest Economic Indicators: April 2024 CPI and U.S. Retail Sales

The U.S. Bureau of Labor Statistics and the Census Bureau have recently released critical economic data for April 2024, covering the Consumer Price Index (CPI) and retail sales figures. These releases provide a comprehensive snapshot of the current economic environment, highlighting consumer inflation and retail activity. Let's delve into the details of each report and discuss their broader implications.

Consumer Price Index for April 2024

The Consumer Price Index for All Urban Consumers (CPI-U) rose by 0.3 percent in April on a seasonally adjusted basis, following a 0.4 percent increase in March. Annually, the all items index increased by 3.4 percent before seasonal adjustment. Key takeaways include:

  • Shelter and Gasoline Indexes: These indexes significantly contributed to the monthly CPI rise, with the energy index increasing by 1.1 percent primarily due to these components.

  • Stable Food Prices: The food index remained unchanged, with a notable decrease in the food at home category, offset by increases in food away from home.

  • Less Volatile Core Inflation: Excluding food and energy, the core index also rose by 0.3 percent, indicating stable underlying inflation.

Over the past 12 months, the energy index increased by 2.6 percent, while the food index rose by 2.2 percent, highlighting specific areas where consumers may feel budget pressures.

U.S. Retail Sales in April 2024

The advance estimates of U.S. retail and food services sales for April 2024 were virtually unchanged from March, adjusted for seasonal variation, but showed a 3.0 percent increase from April 2023. Highlights from the report include:

  • Steady Sales Figures: Total sales from February to April 2024 were up 3.0 percent from the same period a year ago, indicating a consistent growth in consumer spending.

  • Strong Online Sales: Nonstore retailers recorded a robust 7.5 percent increase from the previous year, underscoring the ongoing shift towards online shopping.

  • Food Services Growth: Food services and drinking places saw a significant 5.5 percent increase year over year, possibly reflecting consumer confidence and increased social activities.

Implications and Outlook

These reports suggest a cautiously optimistic economic outlook. While inflation, as indicated by the CPI, remains present, its growth is steady rather than sharp, suggesting that inflationary pressures might be stabilizing. Meanwhile, the solid performance in retail sales, particularly in nonstore retailers and food services, points to healthy consumer spending, which is crucial for continued economic growth.

However, the stable yet significant inflation highlighted by the CPI could impact consumer purchasing power, especially if wage growth does not keep pace. This dynamic warrants close monitoring as it may influence future consumer spending and economic policy decisions.

As we look towards the future, these indicators will be vital for policymakers, businesses, and consumers alike to gauge the economic landscape and make informed decisions. The next release in June will provide further insights into whether these trends are holding steady or shifting, marking critical data points for economic forecasts and strategies.

Source: https://www.census.gov/retail/sales.html, https://www.bls.gov/news.release/cpi.nr0.htm


Please let us know your feedback. If you are interested in timestamps, please send us an email to sales@haawks.com.

Start futures forex fx news trading with Haawks G4A low latency machine-readable data today, one of the fastest news data feeds for US macro-economic and commodity data.

Comment

Comment

12 pips potential profit in 8 seconds on 14 May 2024, analysis on futures forex fx low latency news trading USDJPY and EURUSD on US BLS Producer Price Index (PPI) data

According to our analysis USDJPY and EURUSD moved 12 pips on US BLS Producer Price Index (PPI) data on 14 May 2024.

USDJPY (3 pips)

EURUSD (9 pips)

Charts are exported from JForex (Dukascopy).


Analyzing the April 2024 Producer Price Index (PPI) Increase: Key Takeaways and Economic Implications

The U.S. Bureau of Labor Statistics recently released the Producer Price Index (PPI) for April 2024, revealing a notable uptick of 0.5 percent on a seasonally adjusted basis. This increase comes after a slight decline of 0.1 percent in March and marks the largest rise since February's 0.6 percent gain. Over the past 12 months, the unadjusted index for final demand has risen by 2.2 percent, representing the most substantial annual increase since April 2023.

Breakdown of Key Components

1. Services Drive the Increase

Nearly three-quarters of April's rise can be attributed to the services sector, which saw a 0.6 percent increase, primarily driven by a significant 3.9 percent jump in portfolio management costs. Other contributing factors include higher prices in machinery and equipment wholesaling, residential real estate services, and truck transportation of freight.

2. Goods Also Up

Final demand goods increased by 0.4 percent, primarily due to a 5.4 percent rise in gasoline prices, which accounted for most of the increase. Despite this, there was a contrasting decline in food prices, notably a steep 18.7 percent drop in fresh and dry vegetables.

Deeper Insights: Excluding Volatile Sectors

When excluding foods, energy, and trade services, the index still shows a robust increase of 0.4 percent in April, following a 0.2 percent rise in March. This indicator is particularly telling as it excludes sectors that are typically volatile, providing a clearer picture of the underlying inflation trends. Year-over-year, this measure has seen a 3.1 percent increase, the largest since April 2023.

Implications for Economic Policy and Business Planning

The latest PPI data suggests underlying inflationary pressures in the economy, particularly in the services sector. Businesses, especially in sectors directly impacted by rising service costs, will need to adjust their pricing strategies and budgeting plans to accommodate these cost increases. Moreover, policymakers may need to consider these trends when designing monetary policy to ensure inflation targets are met without stifling economic growth.

Future Outlook

Given the PPI's role as a leading indicator of consumer price inflation, the April increase might signal upcoming changes in consumer prices, potentially affecting the Federal Reserve's decisions on interest rates. The economic landscape remains dynamic, and these price trends provide critical insights into the broader economic health.

As we look forward to the May 2024 PPI report scheduled for release on June 13, businesses and policymakers alike must stay vigilant and responsive to these evolving economic indicators.

This data not only helps in anticipating economic trends but also serves as a crucial tool for financial planning and analysis, ensuring stakeholders are well-prepared to navigate the complexities of an ever-changing economic environment.

Source: https://www.bls.gov/news.release/ppi.nr0.htm


Start futures forex fx news trading with Haawks G4A low latency machine-readable data, one of the fastest machine-readable news trading feed for US economic and commodity data.

Please let us know your feedback. If you are interested in timestamps, please send us an email to sales@haawks.com.

Comment

Comment

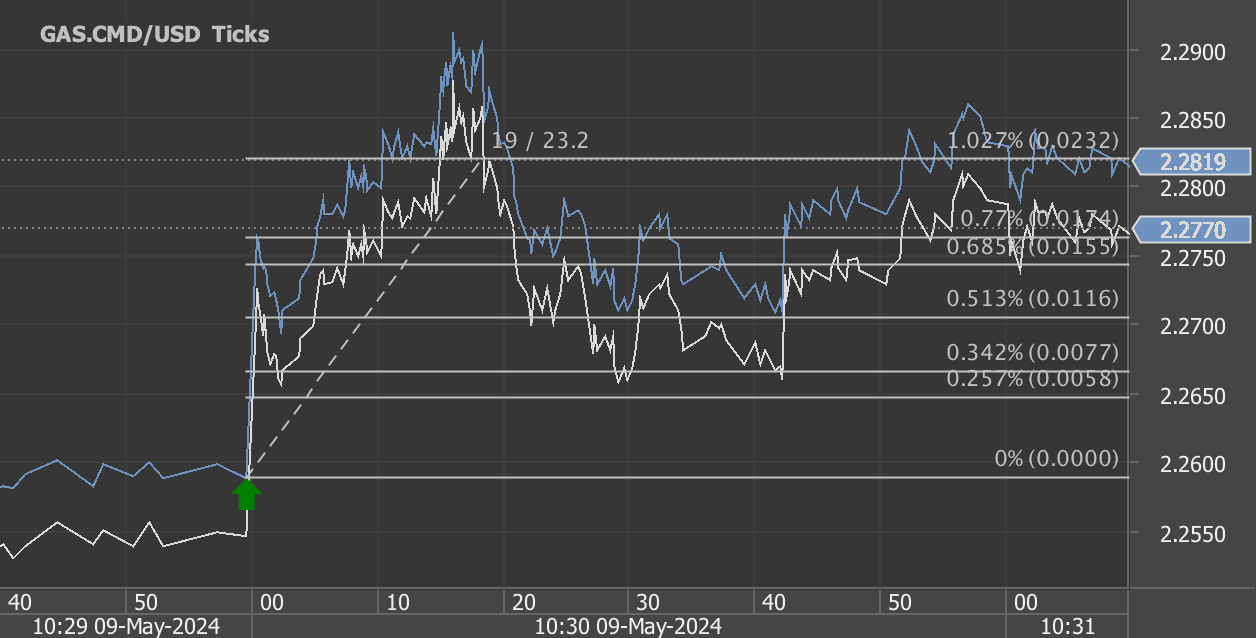
23 ticks potential profit in 19 seconds on 9 May 2024, analysis on futures forex fx news trading natural gas on DOE Natural Gas Storage Report data

According to our analysis natural gas moved 23 ticks on DOE Natural Gas Storage Report data on 9 May 2024.

Natural gas (23 ticks)

Charts are exported from JForex (Dukascopy).


U.S. Natural Gas Storage Update: Significant Stock Increases

As of May 3, 2024, the United States has seen a notable increase in its natural gas storage, according to the latest Weekly Natural Gas Storage Report released by the Energy Information Administration (EIA). The report, which provides an insightful snapshot into the nation's energy reserves, highlights a substantial storage volume of 2,563 billion cubic feet (Bcf). This represents a significant weekly increase of 79 Bcf, underscoring a robust addition to the nation's energy reserves.

Regional Breakdown and Historical Comparisons

The storage levels vary significantly across different regions:

  • East: The Eastern region now holds 454 Bcf, marking a substantial weekly increase of 29 Bcf. This volume is notably higher than the previous year's 419 Bcf and surpasses the five-year average of 351 Bcf by a remarkable 29.3%.

  • Midwest: This region shows a robust increase, with current stocks at 584 Bcf compared to 492 Bcf a year ago—an 18.7% increase. The figure also exceeds the five-year average by 37.7%.

  • Mountain: Here, the stocks stand at 191 Bcf, up from 101 Bcf last year, showcasing a dramatic year-over-year rise of 89.1%. The volume is also well above the five-year average by 85.4%.

  • Pacific: Stocks have reached 246 Bcf, up from last year’s 110 Bcf, marking a striking increase of 123.6% above the prior year and 35.2% over the five-year average.

  • South Central: Totaling 1,087 Bcf, this region's stocks have risen by 14 Bcf over the week, with a notable 9.2% increase over the previous year and a 26.1% rise above the five-year average.

Specifically, within the South Central region, the nonsalt facilities saw a noteworthy increase, reflecting a broader trend of robust inventory building across various storage types.

Implications for Energy Markets

The current levels of working gas in underground storage are substantially above both last year’s figures and the five-year average. This increased stock could suggest a more secure energy landscape in the U.S. for the short term, potentially stabilizing natural gas prices and offering some buffer against supply disruptions.

Moreover, the high storage levels are likely to play a crucial role in managing seasonal demand fluctuations, especially as the country approaches the high-demand summer months. Utilities and energy providers may find some relief in these figures, as ample storage typically translates into more manageable costs for end consumers.

Looking Ahead

With the next update scheduled for May 16, 2024, market participants and analysts will be keenly watching for signs of continued stock building or any adjustments in the flow dynamics. The detailed regional data will also help in assessing the local impacts on energy markets, crucial for local distributors and consumers alike.

In conclusion, the EIA’s latest report not only reflects a positive trend in natural gas availability but also underscores the resilience and strategic management of energy resources within the U.S. As stakeholders continue to navigate through the complexities of energy supply and demand, these storage figures provide a critical data point in the broader energy discourse.

Source: https://ir.eia.gov/ngs/ngs.html


Start futures forex fx commodity news trading with Haawks G4A low latency machine-readable data, one of the fastest data feeds for DOE data.

Please let us know your feedback. If you are interested in timestamps, please send us an email to sales@haawks.com.

Comment