We are pleased to announce that there was a potential of 803 pips/ticks, US500 34 points and BTC 2275 points profit out of the following 18 events in the third quarter of 2025 based on our ex-post analysis. The potential performance for 2024 was 4,305 pips/ticks.
Q3 2025
US Employment Situation (Non-farm payrolls / NFP) (61 pips / 3 July 2025)
US Jobless Claims (13 pips / 10 July 2025)
USDA WASDE (World Agricultural Supply and Demand Estimates) (76 ticks / 11 July 2025)
US BLS Producer Price Index (PPI) (16 pips, US500 3 points / 16 July 2025)
US Jobless Claims (19 pips / 24 July 2025)
US Gross Domestic Product (GDP) (11 pips, BTC 95 points / 30 July 2025)
US Employment Situation (Non-farm payrolls / NFP) (157 pips, BTC 158 poins / 1 August 2025)
DOE Natural Gas Storage Report (19 ticks / 7 August 2025)
US BLS Consumer Price Index (CPI) (59 pips, US500 17 points, BTC 461 points / 12 August 2025)
USDA World Agricultural Supply and Demand Estimates (WASDE) (96 ticks / 12 August 2025)
US BLS Producer Price Index (PPI) (42 pips, BTC 437 points / 14 August 2025)
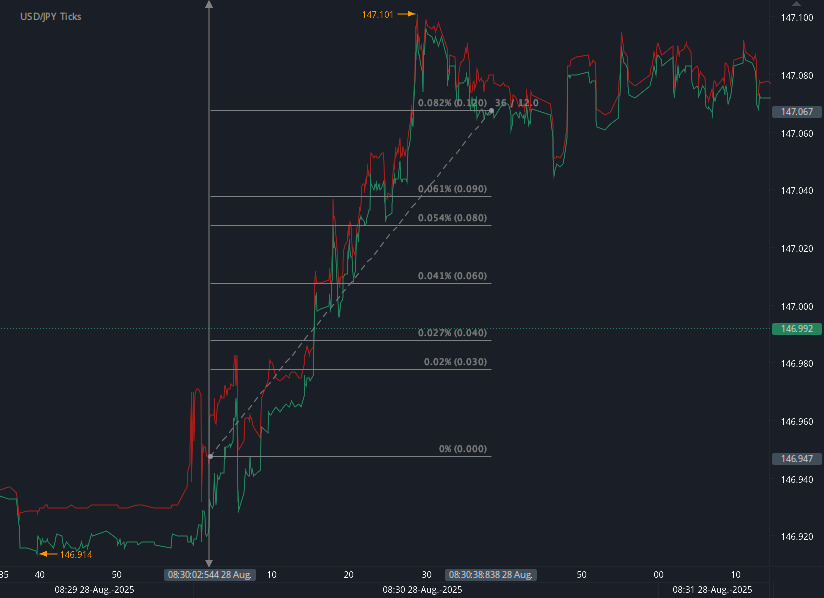
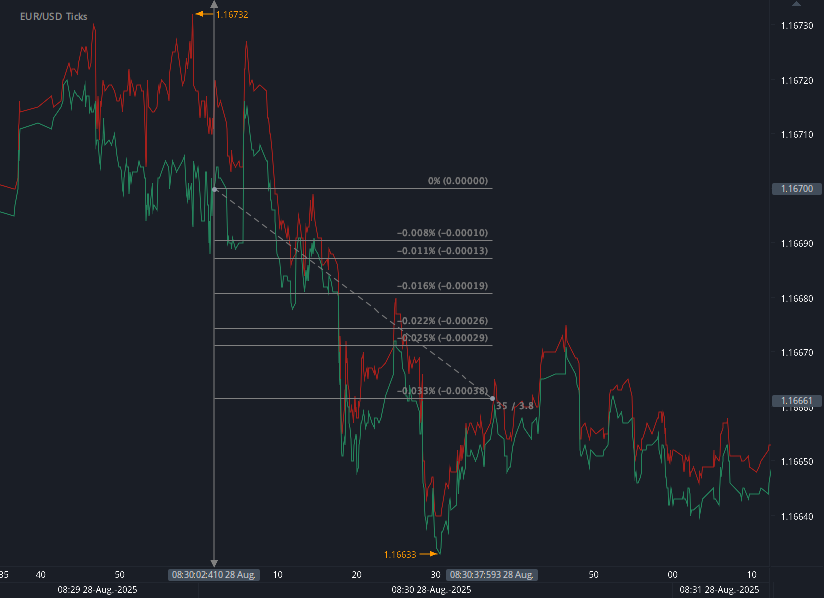
US Gross Domestic Product (GDP) (15 pips / 28 August 2025)
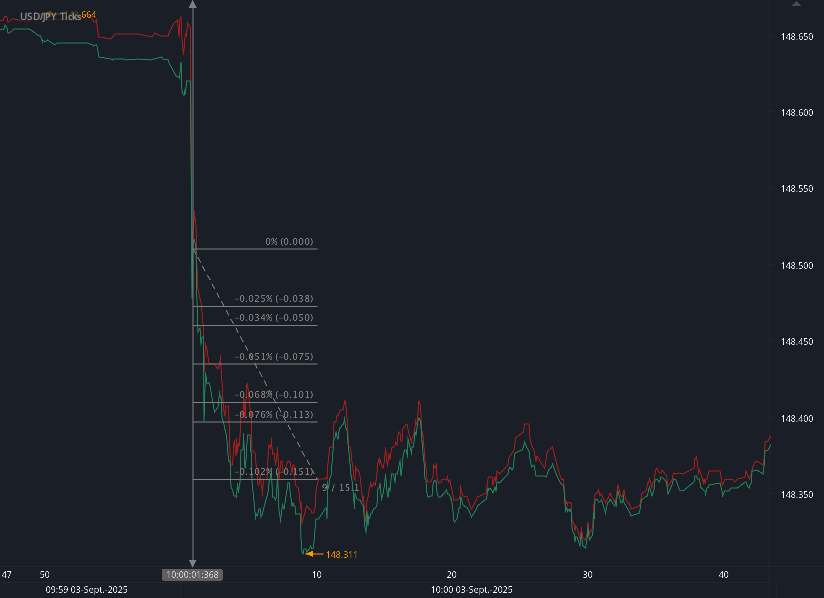
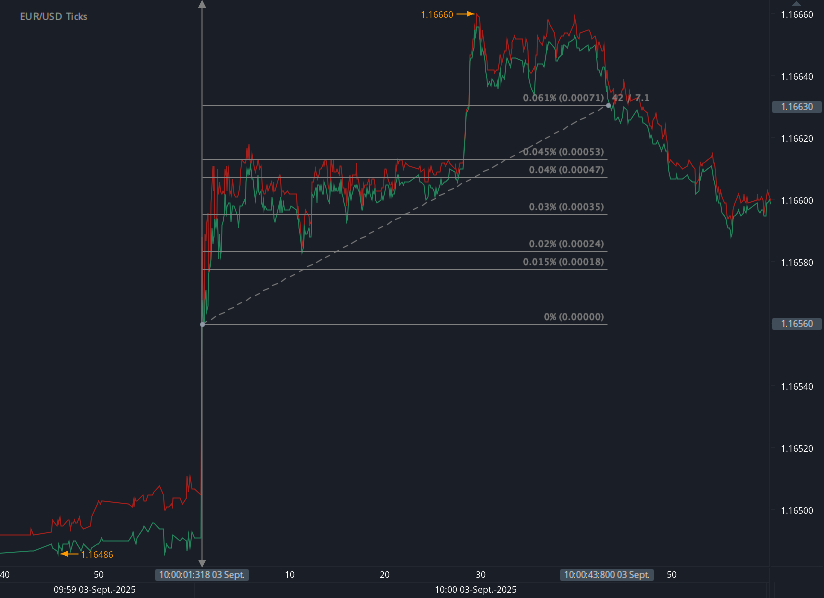
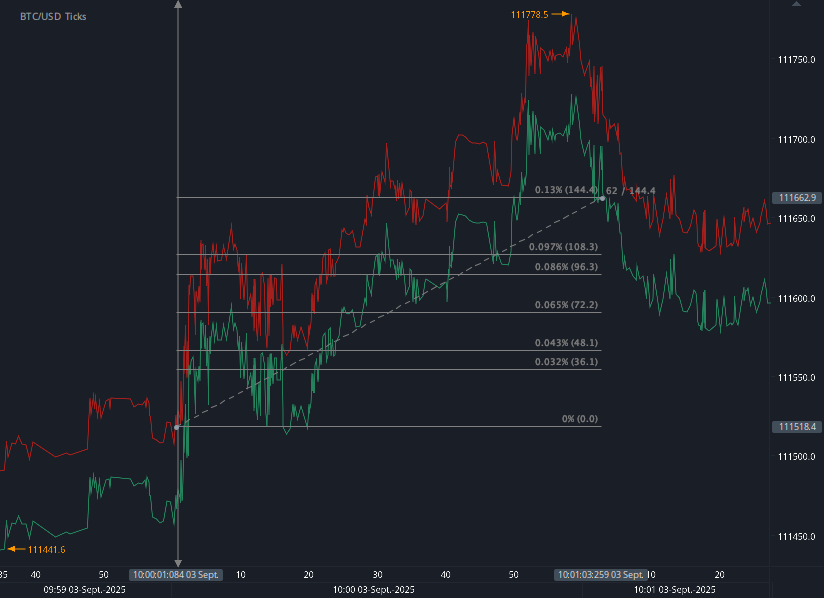
US BLS Job Openings and Labor Turnover Survey (JOLTS) (22 pips, BTC 144 points / 3 September 2025)
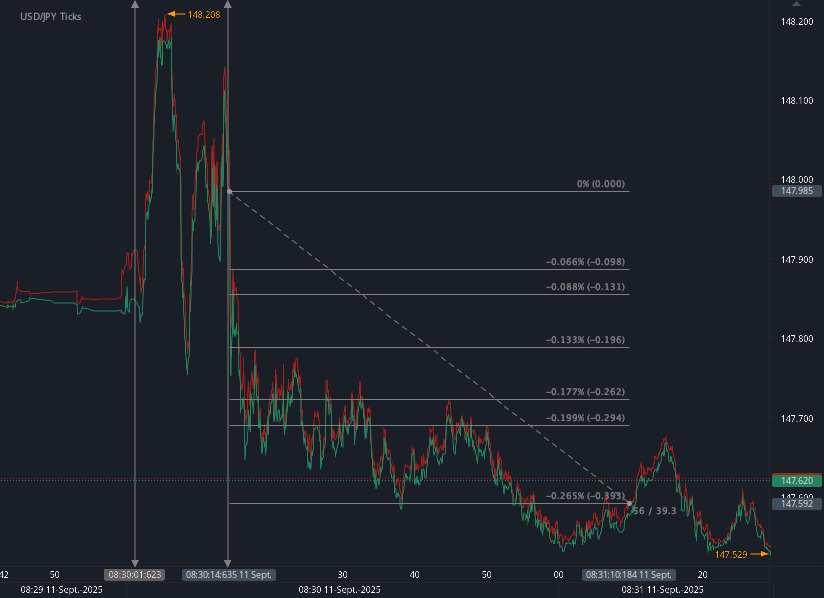
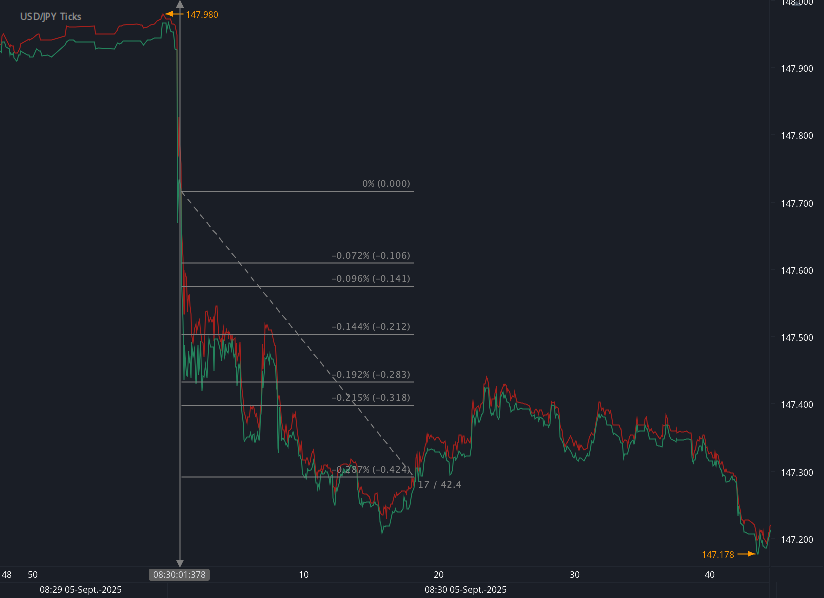
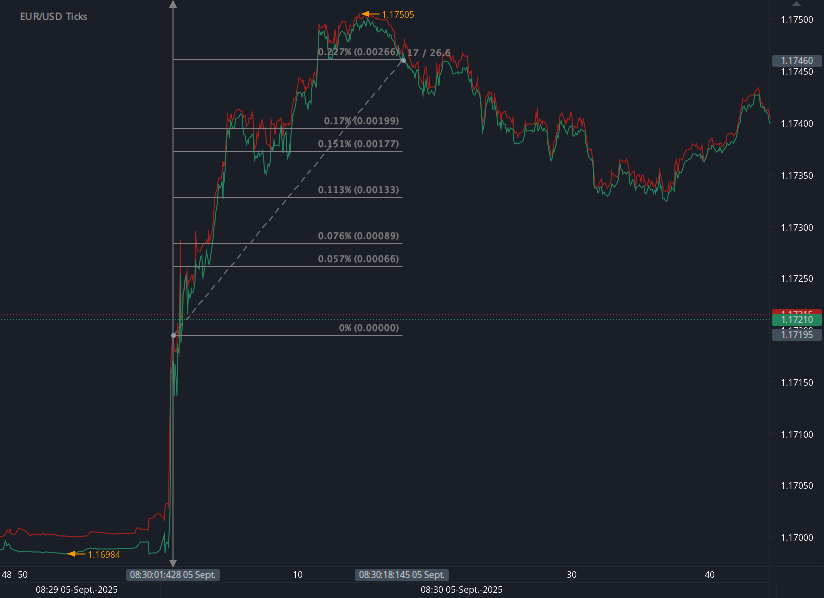
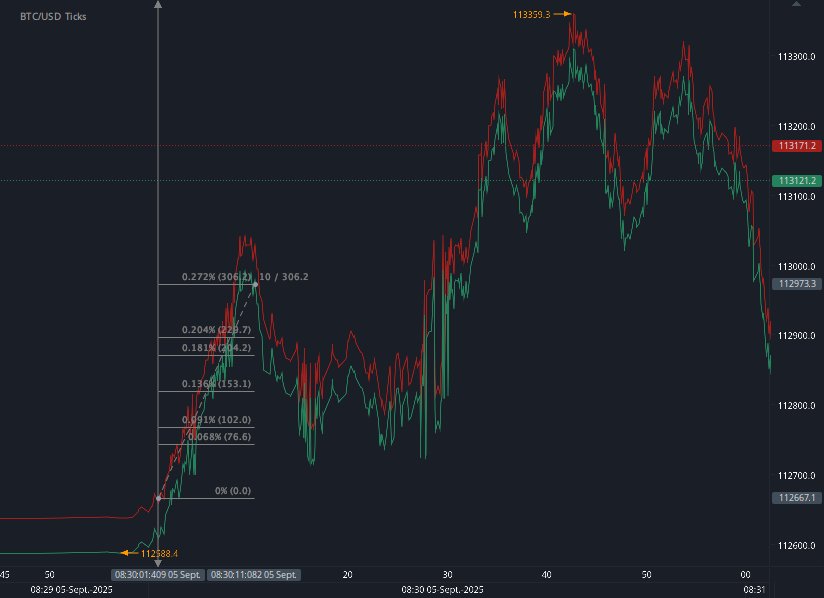
US Employment Situation (Non-farm payrolls / NFP) (68 pips, BTC 306 points / 5 September 2025)
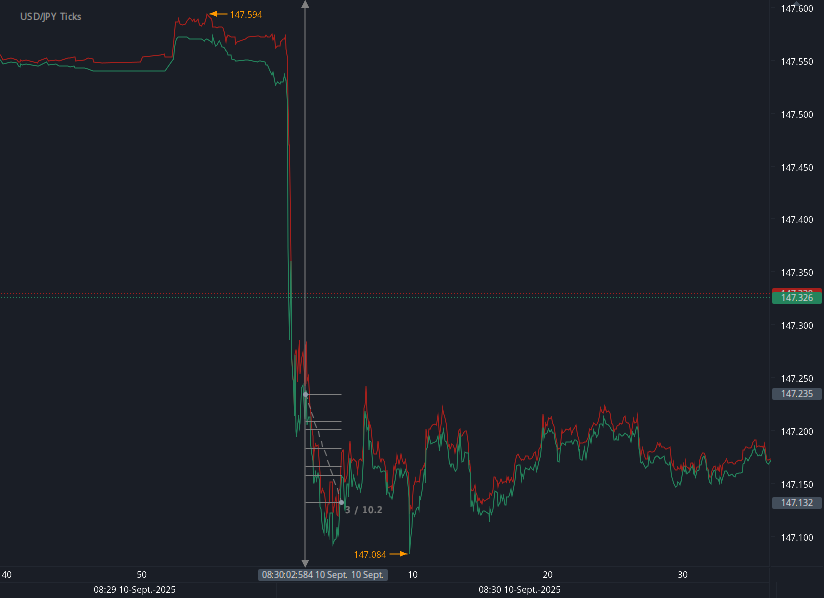
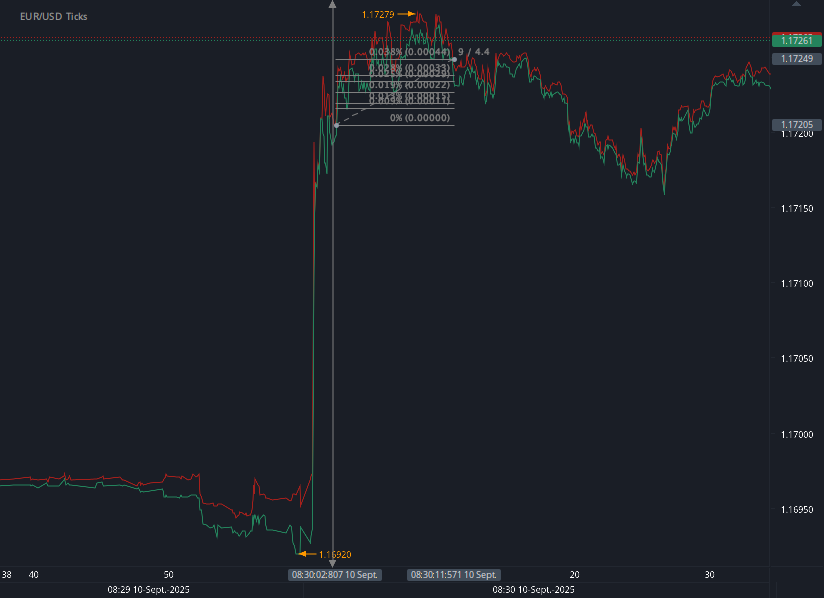
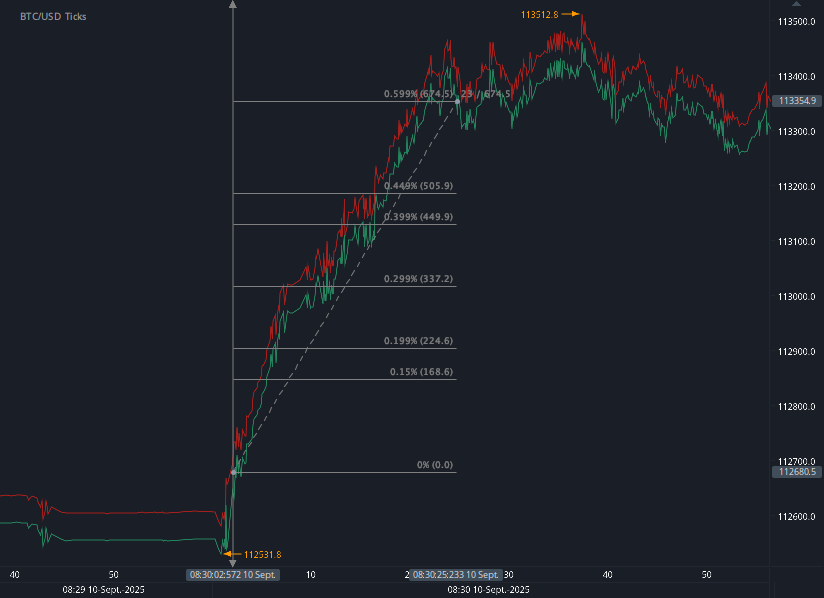
US BLS Producer Price Index (PPI) (14 pips, BTC 674 points / 10 September 2025)
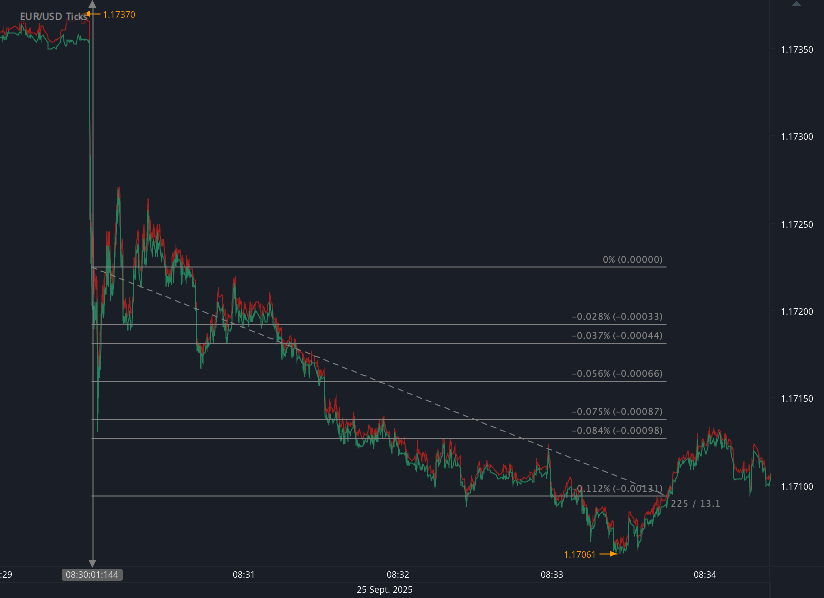
US Consumer Price Index (CPI) and US Jobless Claims (64 pips, US500 14 points / 11 September 2025)
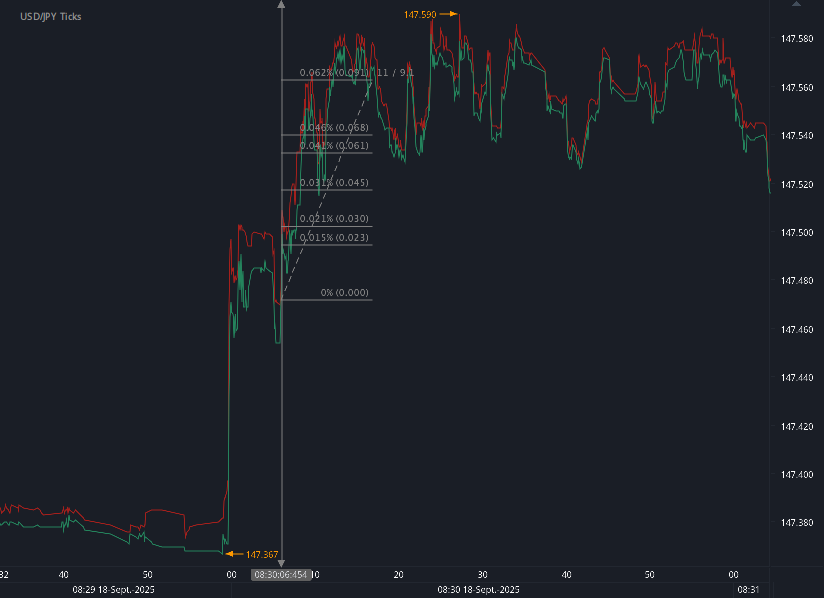
US Jobless Claims (16 pips / 18 September 2025)
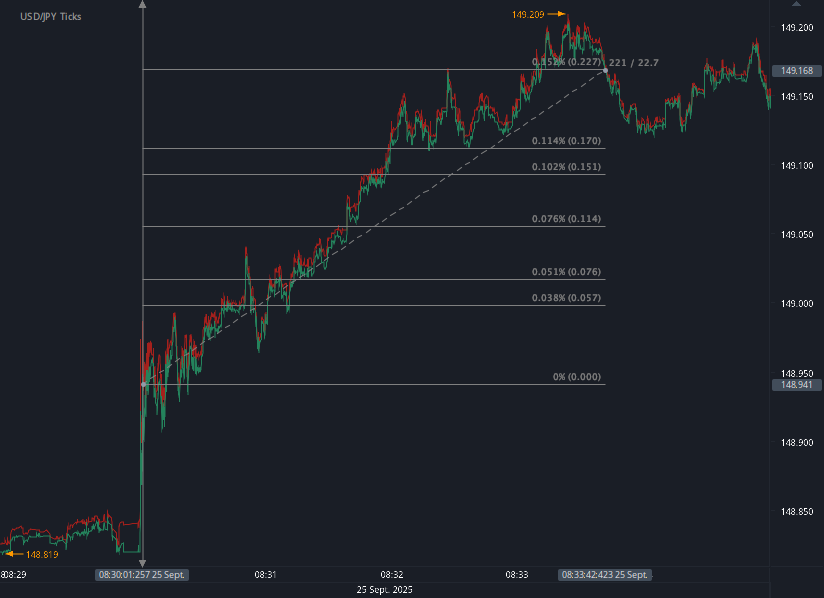
US Jobless Claims (35 pips / 25 September 2025)
Total trading time would have been around 25 minutes in 3 months! (preparation time not included)
You can click on each release for detailed information.
Key Market-Moving US Economic Events: July–September 2025 Recap
The past quarter has been packed with high-impact US economic data releases, each sparking notable volatility across forex, equities, commodities, and even crypto markets. From Non-Farm Payrolls (NFP) to inflation data, here’s a breakdown of how the major reports moved the markets between July and September 2025.
July 2025: A Strong Start With Jobs and Inflation
US Employment Situation (NFP) – 3 July
The July 3rd NFP release triggered a 61-pip move in FX markets, setting the tone for the month. Traders watched closely for labor market signals amid Fed policy uncertainty.US Jobless Claims – 10 July
A lighter reaction with 13 pips of movement, but still relevant for short-term positioning.USDA WASDE Report – 11 July
Agriculture markets saw significant volatility, with 76 ticks of movement, underscoring the importance of crop outlooks on commodities.US Producer Price Index (PPI) – 16 July
Inflation pressures were in focus, sparking 16 pips in FX and a 3-point shift in US500 futures.US Jobless Claims – 24 July
Another labor snapshot, this time moving markets by 19 pips.US GDP – 30 July
Growth data delivered moderate volatility with 11 pips in FX and 95 points in BTC, highlighting crypto’s sensitivity to macroeconomic headlines.
August 2025: Inflation Surprises and Strong NFP
US Employment Situation (NFP) – 1 August
A blockbuster jobs report moved markets aggressively: 157 pips in FX and 158 points in BTC.DOE Natural Gas Storage – 7 August
Natural gas traders reacted with 19 ticks of volatility, typical for this energy report.US CPI – 12 August
Inflation data hit hard, shaking multiple markets: 59 pips in FX, 17 points in US500, and 461 points in BTC.USDA WASDE – 12 August
On the same day, agriculture markets swung 96 ticks, making it a highly volatile session across asset classes.US PPI – 14 August
Another inflation measure sent waves through FX and crypto: 42 pips and 437 points in BTC.US GDP – 28 August
The growth snapshot added 15 pips of volatility—less dramatic but still watched closely.
September 2025: Jobs, JOLTS, and Inflation Drive Swings
US JOLTS Report – 3 September
Labor demand data pushed markets by 22 pips and 144 points in BTC.US NFP – 5 September
The jobs report once again stood out, causing 68 pips in FX and 306 points in BTC.US PPI – 10 September
An outsized reaction this time: 14 pips in FX but a massive 674-point swing in BTC.US CPI & Jobless Claims – 11 September
A dual release that shook risk assets: 64 pips in FX, 14 points in US500, with crypto also under pressure.US Jobless Claims – 18 September
A mid-month update triggered 16 pips of movement.US Jobless Claims – 25 September
The final September claims report surprised with a stronger reaction, moving 35 pips.
Takeaways: Macro Data Is Driving Cross-Asset Volatility
NFP and CPI remain the top-tier movers. Both repeatedly generated triple-digit moves in crypto and sizable swings in FX.
Crypto is hyper-sensitive to macro. BTC reacted sharply to GDP, CPI, and especially PPI, showing greater volatility than traditional markets.
Agriculture markets still hinge on WASDE. July and August reports saw 70–90 tick swings, keeping commodity traders on edge.
Jobless claims matter when surprises hit. While often lower-impact, the late-September release caused 35 pips of volatility—showing that context matters.
As Q4 2025 approaches, markets remain highly reactive to US economic data, especially labor market reports and inflation metrics. Traders should prepare for continued volatility as the Federal Reserve balances growth concerns with inflation management.
Disclaimer: This blog post is for informational purposes only and should not be construed as financial advice. Always conduct thorough research and consider seeking advice from a financial professional before making any investment decisions.
Start futures/forex/oil/grains news trading with Haawks G4A low latency machine-readable data today, we offer one of the fastest machine-readable data feeds for US macro-economic and commodity data and macro-economic data from Norway, Sweden, Switzerland Turkey and ECB interest rates and statement.
Please let us know your feedback and check out our G4A low latency data feed.
All data is machine readable and available via API access in Chicago, New York and London. Free trials.