According to our analysis there was a potential of 544 pips / ticks profit out of the following 11 events in October 2023. The potential performance in 2022 was 9,269 pips / ticks.
October 2023
US Employment Situation (Non-farm payrolls / NFP) (9 pips & 115 points / 6 October 2023)
US BLS Consumer Price Index (CPI) (11 pips / 12 October 2023)
DOE Natural Gas Storage Report (67 ticks / 12 October 2023)
USDA WASDE (World Agricultural Supply and Demand Estimates) (84 ticks / 12 October 2023)
Sweden Consumer Price Index (CPI) (154 pips / 13 October 2023)
University Michigan Consumer Sentiment / Inflation Expectations (15 pips & 37 points / 13 October 2023)
US Census Bureau Retail Sales (13 pips / 17 October 2023)
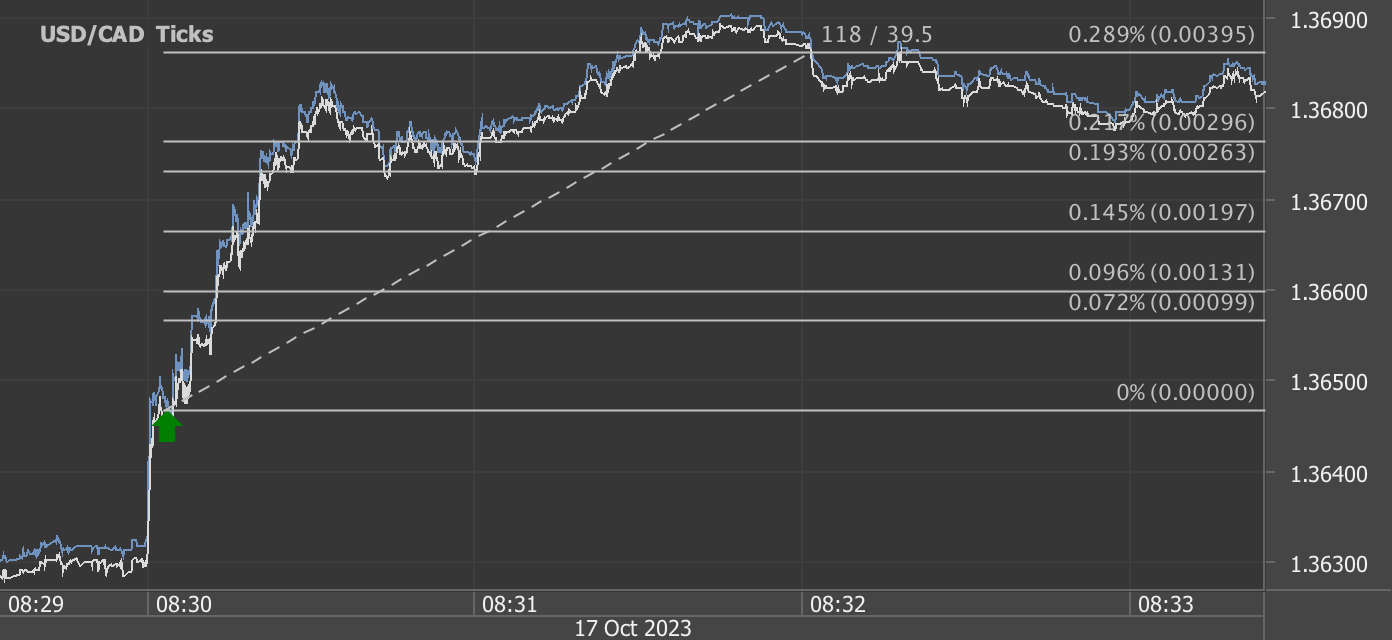
Canada Consumer Price Index (CPI) (39 pips / 17 October 2023)
DOE Petroleum Status Report (49 ticks / 18 October 2023)
DOE Natural Gas Storage Report (83 ticks / 19 October 2023)
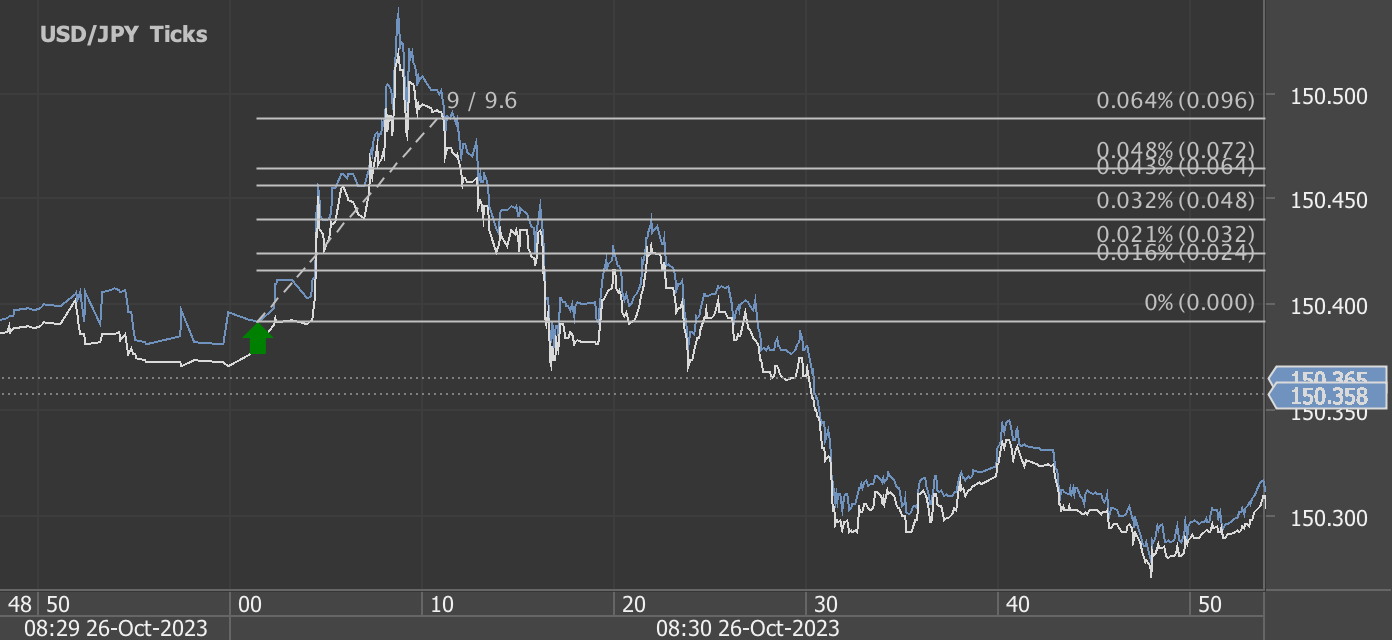
US Durable Goods Orders and US Gross Domestic Product (GDP) (20 pips / 26 October 2023)
Total trading time would have been around 11 minutes! (preparation time not included)
In October 2023, financial markets were influenced by a series of key economic events and reports, each carrying the potential to impact asset prices and trading strategies. The total potential pips and ticks for the month amounted to 544, reflecting the overall market volatility and the opportunities it presented to traders and investors.
Some of the notable events and their respective point values included:
US Non-farm Payrolls (NFP) with a potential of 115 points on October 6th, indicating the significance of employment data for market sentiment.
US Consumer Price Index (CPI) with 11 pips on October 12th, highlighting the importance of inflation data.
DOE Natural Gas Storage Report with 67 ticks on October 12th and 83 ticks on October 19th, signifying the influence of energy supply and demand dynamics.
USDA World Agricultural Supply and Demand Estimates (WASDE) with 84 ticks on October 12th, demonstrating the relevance of agricultural commodity data.
Sweden Consumer Price Index (CPI) with 154 pips on October 13th, illustrating the impact of inflation data in a global context.
University of Michigan Consumer Sentiment/Inflation Expectations with 15 pips and 37 points on October 13th, indicating consumer sentiment's role in shaping market trends.
US Census Bureau Retail Sales with 13 pips on October 17th, reflecting the importance of consumer spending.
Canada Consumer Price Index (CPI) with 39 pips on October 17th, mirroring the significance of inflation data in the Canadian context.
DOE Petroleum Status Report with 49 ticks on October 18th, influencing the energy market and related stocks.
US Durable Goods Orders and US Gross Domestic Product (GDP) with 20 pips on October 26th, highlighting the influence of economic health indicators.
In summary, October 2023 presented traders and investors with a variety of economic events that collectively offered the potential for 544 pips and ticks. These events encompassed a broad range of economic data, including employment, inflation, energy supply, agriculture, consumer sentiment, and economic growth. Understanding the significance of these events and their potential impact on financial markets was crucial for those seeking to navigate the complex world of finance and make informed investment decisions.
These events and reports presented opportunities for traders to analyze and capitalize on market movements in various financial instruments, from currencies to commodities. While these opportunities carried profit potential, traders should always be mindful of market risks and exercise prudent trading practices.
Start futures/forex/oil/grains news trading with Haawks G4A low latency machine-readable data today, we offer the fastest machine-readable data feed for US economic and commodity data and economic data from Norway, Sweden, Turkey and ECB interest rates and statement.
Please let us know your feedback and check out our G4A low latency data feed.
All data is machine readable and available via API access in Aurora, CH1, NY4 and LD4. Free trials.