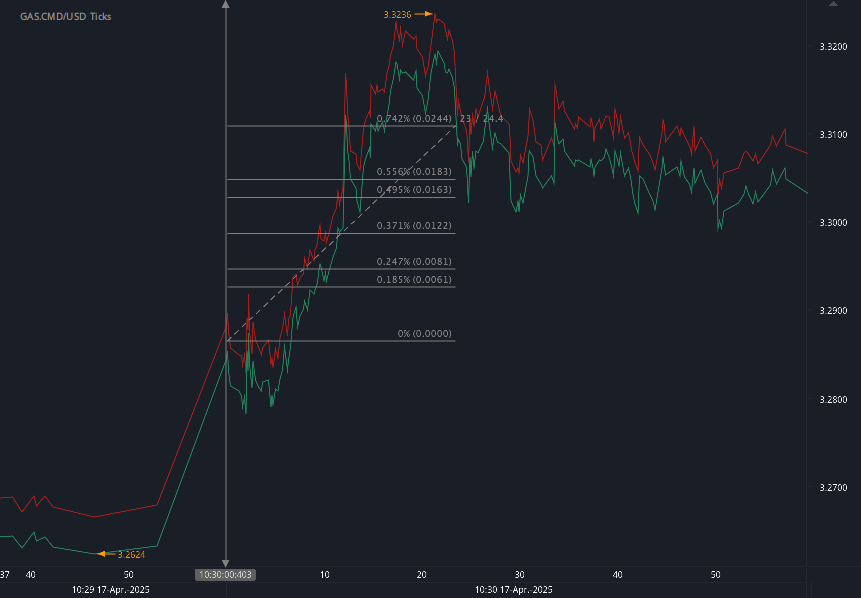
According to our analysis natural gas moved 55 ticks on DOE Natural Gas Storage Report data on 1 May 2025.
Natural gas (55 ticks)
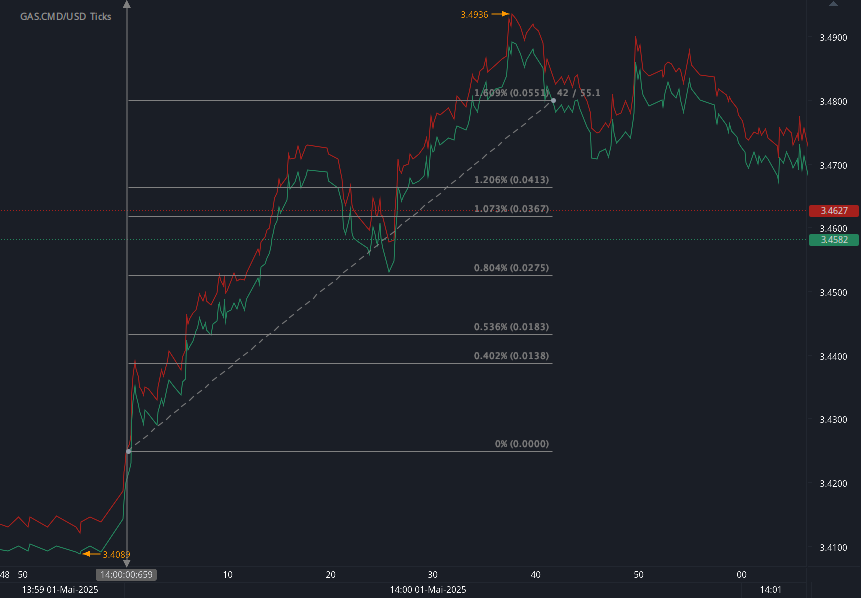
Charts are exported from JForex (Dukascopy).
Natural Gas Storage Inches Upward as Spring Builds Continue
May 2, 2025
The U.S. Energy Information Administration (EIA) released its latest Weekly Natural Gas Storage Report on May 1, 2025, revealing a notable build in underground natural gas stocks as the country transitions deeper into spring. For the week ending April 25, 2025, working gas in storage across the Lower 48 states rose by 107 billion cubic feet (Bcf), bringing total inventories to 2,041 Bcf.
This increase keeps gas storage slightly ahead of the five-year average of 2,036 Bcf and narrows the year-on-year deficit, although stocks still trail last year's levels by 435 Bcf, a decline of 17.6%.
Regional Storage Trends
Breaking it down by region:
East: Added 36 Bcf, reaching 331 Bcf—down 21.7% from last year.
Midwest: Increased by 29 Bcf to 425 Bcf, 24.4% lower than a year ago.
Mountain: Saw a modest build of 3 Bcf to 174 Bcf, only 3.9% off from 2024 levels.
Pacific: Added 5 Bcf to hit 226 Bcf, down 5.4% from last year but still 19.6% above the five-year average.
South Central: Gained 34 Bcf to reach 885 Bcf, with the Salt component up 15 Bcf and Nonsalt up 20 Bcf.
Despite the year-over-year deficit, this week's build puts national storage comfortably within the five-year historical range—an encouraging sign for market stability heading into the summer months.
A Closer Look at Variability
The EIA also provided sampling variability estimates. The total coefficient of variation for stocks was just 0.4%, suggesting high reliability in this week's numbers. Standard error for the net change was only ±1.0 Bcf, reinforcing confidence in the reported 107 Bcf injection.
Outlook
With injection season ramping up, attention turns to weather forecasts, LNG export trends, and domestic demand as key drivers of storage trajectories in the weeks ahead. If moderate builds like this week’s continue, the market could see a more balanced setup heading into the heating season later this year, despite the current shortfall relative to 2024.
Stay tuned for the next report on May 8, 2025, for updates on how U.S. storage levels are evolving.
Disclaimer: This blog post is for informational purposes only and should not be construed as financial advice. Always conduct thorough research and consider seeking advice from a financial professional before making any investment decisions.
Source: https://ir.eia.gov/ngs/ngs.html
Start futures forex fx commodity news trading with Haawks G4A low latency machine-readable data, one of the fastest data feeds for DOE data.
Please let us know your feedback. If you are interested in timestamps, please send us an email to sales@haawks.com.