Blog — HAAWKS

Viewing entries tagged
natural gas

Comment

Share

21 ticks potential profit in 20 seconds on 11 April 2024, analysis on futures forex fx news trading natural gas on DOE Natural Gas Storage Report data

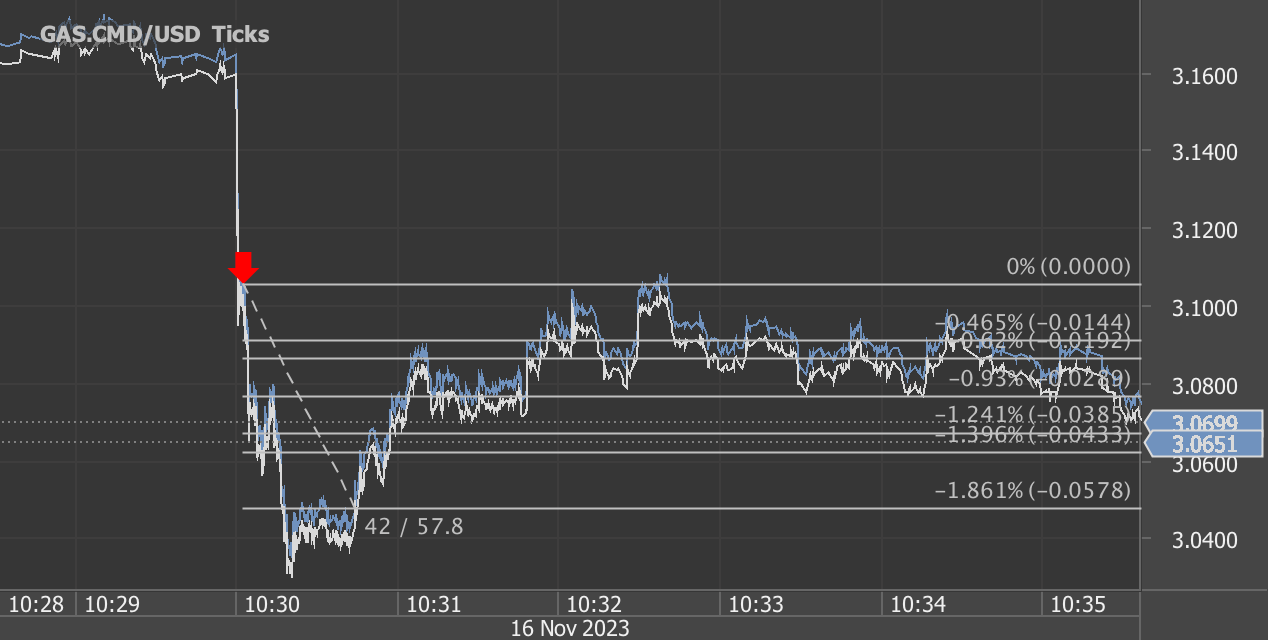
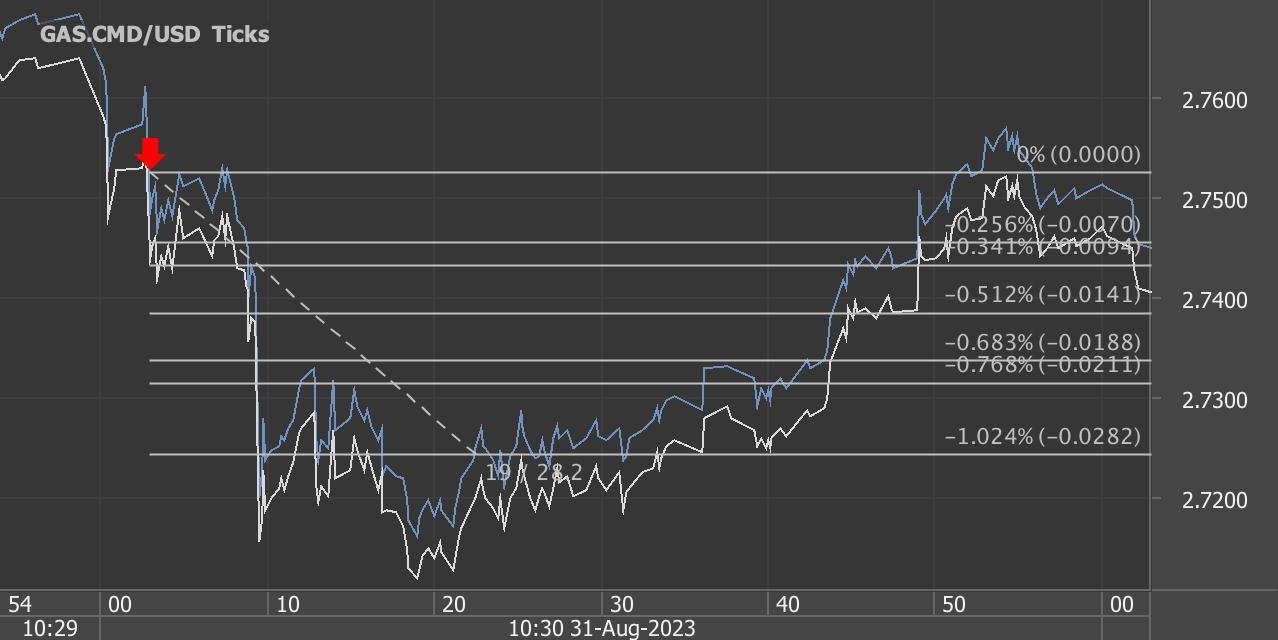
According to our analysis natural gas moved 21 ticks on DOE Natural Gas Storage Report data on 11 April 2024.

Natural gas (21 ticks)

Charts are exported from JForex (Dukascopy).


Understanding the Latest Trends in Natural Gas Storage: Insights from the April 11, 2024 EIA Report

The Energy Information Administration (EIA) has recently released its latest Weekly Natural Gas Storage Report, providing data up to April 5, 2024. This crucial update gives us insights into the state of natural gas storage across the United States, reflecting changes over the past week and comparisons with historical data. Here’s a deep dive into what these numbers mean and their potential implications for the market and consumers.

Current Storage Levels and Weekly Changes

As of April 5, 2024, the total working gas in underground storage in the Lower 48 states stood at 2,283 billion cubic feet (Bcf). This marks a net increase of 24 Bcf from the previous week. Notably, the current storage levels are significantly above last year's figures at this time, which were at 1,848 Bcf, and also surpass the five-year average of 1,650 Bcf. This indicates a robust increase in gas storage, suggesting a stronger storage position relative to previous years.

Regional Analysis

The report details specific changes in various regions:

  • East: A slight decrease of 1 Bcf, totaling 362 Bcf.

  • Midwest: An increase of 2 Bcf, reaching 512 Bcf.

  • Mountain: An increase of 3 Bcf, now at 165 Bcf.

  • Pacific: Also up by 2 Bcf, totaling 229 Bcf.

  • South Central: The largest increase observed here, with 18 Bcf added, now totaling 1,014 Bcf.

Each region shows different trends, but overall, the increases are contributing to a greater national storage capacity, which could influence gas prices and energy policy.

Year-on-Year and Five-Year Comparisons

The comparison with last year and the five-year average gives us an idea of the long-term trends affecting natural gas storage:

  • The total stocks are 23.5% higher than the same time last year.

  • They are also 38.4% above the five-year average.

These significant increases could be due to various factors, including changes in production levels, shifts in energy consumption patterns, or preemptive storage in anticipation of different market conditions.

Implications for Markets and Consumers

With natural gas storage levels being well above average, this could lead to a stabilizing effect on natural gas prices, barring any sudden increases in demand or major geopolitical events. Consumers might benefit from relatively stable or possibly lower energy prices in the near term. However, energy producers might face challenges with lower prices affecting their revenue streams.

Future Outlook

Looking ahead, the next update scheduled for April 18, 2024, will provide further insights into the trends we're observing. Monitoring these trends is crucial for market participants and policymakers to make informed decisions.

In conclusion, the latest EIA report highlights a strong position in natural gas storage compared to previous years. This situation presents both opportunities and challenges in the energy market. As always, it will be important to keep an eye on how these trends evolve in response to economic, environmental, and political factors.

Source: https://ir.eia.gov/ngs/ngs.html


Start futures forex fx commodity news trading with Haawks G4A low latency machine-readable data, one of the fastest data feeds for DOE data.

Please let us know your feedback. If you are interested in timestamps, please send us an email to sales@haawks.com.

Comment

Share

Comment

Share

10 ticks potential profit in 22 seconds on 4 April 2024, analysis on futures forex fx news trading natural gas on DOE Natural Gas Storage Report data

According to our analysis natural gas moved 10 ticks on DOE Natural Gas Storage Report data on 4 April 2024.

Natural gas (10 ticks)

Charts are exported from JForex (Dukascopy).


Analyzing the Latest Shifts in U.S. Natural Gas Storage: A Deep Dive into the Week Ending March 29, 2024

The U.S. Energy Information Administration (EIA) recently unveiled its Weekly Natural Gas Storage Report for the week ending March 29, 2024. This critical snapshot offers invaluable insights into the country's natural gas supply, showcasing a dynamic interplay between demand, storage capacity, and market trends. Here, we delve into the nuances of the latest report, comparing it against historical data to gauge its broader implications on the energy sector and beyond.

Key Highlights from the Latest Report

As of March 29, 2024, working gas in underground storage across the Lower 48 states stood at 2,259 billion cubic feet (Bcf), marking a net decrease of 37 Bcf from the previous week. This shift underscores a significant fluctuation in gas supplies, potentially influencing market dynamics and energy pricing in the short term. Notably, the current storage levels are substantially higher than the previous year's figures and the five-year average, suggesting a robust supply that could stabilize prices and supply chains.

  • Year-over-Year Increase: Stocks were 422 Bcf higher than the same period last year, presenting a considerable 23% increase.

  • Five-Year Average Comparison: When measured against the five-year average of 1,626 Bcf, the current storage levels are 633 Bcf above, reflecting a substantial 38.9% increase.

Regional Breakdown: A Closer Look

The report details specific trends across various regions, each with its unique dynamics and implications:

  • East and Midwest: Both regions saw a net decrease in storage levels, with the East experiencing a 24 Bcf reduction and the Midwest a 18 Bcf drop. Despite these decreases, both areas are still well above their previous year and five-year averages, indicating strong reserves.

  • Mountain and Pacific: The Mountain region reported a modest 4 Bcf decrease, whereas the Pacific region bucked the trend with a 4 Bcf increase. These changes are particularly striking in the context of their year-over-year and five-year average comparisons, showcasing significant variances in regional supply dynamics.

  • South Central: This region, which includes both salt and nonsalt storage facilities, reported a net increase of 5 Bcf, further bolstering its already substantial reserves.

Implications and Insights

The current state of natural gas storage in the U.S. paints a picture of strength and resilience. With storage levels comfortably above the previous year and the five-year average, the immediate outlook for natural gas supplies seems secure. This abundance is likely to have several key implications:

  • Market Stability: Higher storage levels typically translate to more stable natural gas prices, benefiting consumers and industries alike.

  • Energy Security: Robust storage figures contribute to the nation's energy security, ensuring a steady supply to meet domestic demand.

  • Policy and Planning: These trends are vital for policymakers and energy companies as they strategize for the future, balancing environmental concerns with energy needs.

Looking Ahead

As the energy landscape continues to evolve, monitoring natural gas storage levels remains critical for understanding broader market trends and preparing for future challenges. The EIA's next release on April 11, 2024, is eagerly awaited for further insights into these trends. With the energy sector at a crossroads, influenced by both geopolitical events and the push towards sustainability, the significance of such data cannot be overstated.

In conclusion, the latest Weekly Natural Gas Storage Report offers a glimpse into the complex dynamics shaping the U.S. energy sector. By providing a detailed analysis of current storage levels and historical comparisons, this report is an indispensable tool for anyone looking to navigate the intricacies of the energy market.

Source: https://ir.eia.gov/ngs/ngs.html


Start futures forex fx commodity news trading with Haawks G4A low latency machine-readable data, one of the fastest data feeds for DOE data.

Please let us know your feedback. If you are interested in timestamps, please send us an email to sales@haawks.com.

Comment

Share

Comment

Share

38 ticks potential profit in 157 seconds on 29 February 2024, analysis on futures forex fx news trading natural gas on DOE Natural Gas Storage Report data

According to our analysis natural gas moved 38 ticks on DOE Natural Gas Storage Report data on 29 February 2024.

Natural gas (38 ticks)

Charts are exported from JForex (Dukascopy).


Understanding the Latest Shifts in Natural Gas Storage: A Detailed Analysis

In the realm of energy markets, few metrics garner as much attention as the weekly updates on natural gas storage. The latest data for the week ending February 23, 2024, provides a fascinating snapshot of the current state of natural gas reserves in the United States. Released on February 29, 2024, by the Energy Information Administration (EIA), the report indicates significant movements in underground storage levels across the Lower 48 states. Here, we delve into the nuances of these changes and what they could mean for consumers, businesses, and the broader energy landscape.

A Glimpse into the Numbers

The report reveals that as of February 23, 2024, working gas in underground storage stood at 2,374 billion cubic feet (Bcf). This figure marks a notable decrease of 96 Bcf from the previous week, showcasing the dynamic nature of energy storage and its susceptibility to various influencing factors.

When placed in historical context, the current storage levels are considerably higher than in the past. Compared to the same period last year, stocks have risen by 248 Bcf. Even more striking is the comparison with the five-year average for 2019-2023, where the current levels exceed the norm by 498 Bcf. This surplus places the total working gas significantly above the five-year historical range, hinting at a robust buffer that could have implications for market dynamics and pricing.

Regional Insights

The breakdown by region offers a closer look at where these changes are most pronounced:

  • East: The East region saw a reduction of 52 Bcf, bringing its stocks slightly below the same period last year by 0.4%, yet still above the five-year average by 10.8%.

  • Midwest: A decrease of 31 Bcf in the Midwest contributed to a 9.5% increase from last year and a 24.5% rise above the five-year average.

  • Mountain: The Mountain region experienced a modest drop of 4 Bcf, resulting in a significant 69% jump from both last year and the five-year average.

  • Pacific: Remarkably, the Pacific region's stocks remained unchanged week-over-week, yet they are 117% higher than last year and 35.6% above the five-year average.

  • South Central: This region saw a decrease of 9 Bcf, maintaining a slight increase of 1.3% from the previous year and a notable 29% above the five-year average.

Implications for the Market

The substantial overall increase in natural gas storage compared to historical averages suggests a comfortable supply situation in the U.S. This surplus could potentially lead to stabilized, if not lower, natural gas prices in the short term, benefiting consumers and businesses alike. However, the energy market is notoriously volatile, influenced by factors such as weather conditions, production levels, and geopolitical events. Therefore, while the current storage levels offer a cushion, stakeholders should remain vigilant and responsive to any shifts in the market landscape.

Looking Ahead

As we approach the end of the heating season, the dynamics of natural gas storage and consumption will continue to evolve. The next release, scheduled for March 7, 2024, will further elucidate trends and inform strategies for producers, consumers, and investors. In the meantime, the current data underscores the importance of strategic energy management and the potential for natural gas to play a pivotal role in meeting the nation's energy needs in a sustainable and cost-effective manner.

In conclusion, the latest EIA report on natural gas storage highlights a moment of relative abundance in the U.S. energy landscape. By keeping a close eye on these developments, stakeholders can navigate the market more effectively, leveraging opportunities and mitigating risks in the ever-changing energy sector.

Source: https://ir.eia.gov/ngs/ngs.html


Start futures forex fx commodity news trading with Haawks G4A low latency machine-readable data, one of the fastest data feeds for DOE data.

Please let us know your feedback. If you are interested in timestamps, please send us an email to sales@haawks.com.

Comment

Share

Comment

Share

57 ticks potential profit in 42 seconds on 16 November 2023, analysis on futures forex fx news trading natural gas on DOE Natural Gas Storage Report data

According to our analysis natural gas moved 57 ticks on DOE Natural Gas Storage Report data on 16 November 2023.

Natural gas (57 ticks)

Charts are exported from JForex (Dukascopy).


The Weekly Natural Gas Storage Report provides information on the current status of natural gas storage in the United States. Here's a summary of the key data for the week ending November 10, 2023:

Working Gas in Underground Storage:

  • Total working gas in storage: 3,833 billion cubic feet (Bcf)

  • Net change from the previous week: +60 Bcf (an increase)

  • Working gas stocks compared to last year: +198 Bcf

  • Working gas stocks compared to the five-year average: +203 Bcf

Regional Breakdown:

  1. East Region:

    • Working gas stocks: 931 Bcf

    • Net change: +7 Bcf

    • Compared to last year: +51 Bcf

    • Compared to the five-year average: +34 Bcf

  2. Midwest Region:

    • Working gas stocks: 1,116 Bcf

    • Net change: +11 Bcf

    • Compared to last year: +34 Bcf

    • Compared to the five-year average: +34 Bcf

  3. Mountain Region:

    • Working gas stocks: 256 Bcf

    • Net change: +3 Bcf

    • Compared to last year: +48 Bcf

    • Compared to the five-year average: +46 Bcf

  4. Pacific Region:

    • Working gas stocks: 292 Bcf

    • Net change: +8 Bcf

    • Compared to last year: +50 Bcf

    • Compared to the five-year average: +16 Bcf

  5. South Central Region:

    • Working gas stocks: 1,238 Bcf

    • Net change: +32 Bcf

    • Compared to last year: +65 Bcf

    • Compared to the five-year average: +65 Bcf

    • Salt Caverns: 332 Bcf (+19 Bcf)

    • Nonsalt Facilities: 906 Bcf (+13 Bcf)

Summary:

  • Total working gas in storage is within the five-year historical range.

  • The overall increase in working gas compared to the previous week was 60 Bcf.

  • Stocks are higher than both last year and the five-year average by 198 Bcf and 203 Bcf, respectively.

It's worth noting that the data is subject to independent rounding, and totals may not equal the sum of components. The next release of the Weekly Natural Gas Storage Report is scheduled for November 22, 2023.

Source: https://ir.eia.gov/ngs/ngs.html


Start futures forex fx commodity news trading with Haawks G4A low latency machine-readable data, one of the fastest data feeds for DOE data.

Please let us know your feedback. If you are interested in timestamps, please send us an email to sales@haawks.com.

Comment

Share

Comment

Share

83 ticks potential profit in 50 seconds on 19 October 2023, analysis on futures forex fx news trading natural gas on DOE Natural Gas Storage Report data

According to our analysis natural gas moved 83 ticks on DOE Natural Gas Storage Report data on 19 October 2023.

Natural gas (83 ticks)

Charts are exported from JForex (Dukascopy).


Natural Gas Weekly Update – October 18, 2023

In the world of energy commodities, natural gas plays a pivotal role in meeting various demands, from residential heating to electricity generation. Understanding the latest developments in the natural gas market is essential for consumers, businesses, and investors. Here's a recap of the key points from the Natural Gas Weekly Update for the week ending October 18, 2023:

Associated Natural Gas Production Surge: In 2022, associated-dissolved natural gas production (associated natural gas) witnessed a significant 9% increase, reaching 15.5 billion cubic feet per day. This surge was primarily attributed to an 8% growth in crude oil production in major U.S. onshore crude oil-producing regions, such as Permian, Bakken, Eagle Ford, Niobrara, and Anadarko. Associated natural gas, which is dissolved in crude oil and released during oil extraction, accounted for over a third of total natural gas production in these regions and 14% of total U.S. natural gas production.

Market Highlights: For the week ending October 18, 2023, here are the natural gas market highlights:

Prices:

  • The Henry Hub spot price fell from $3.18/MMBtu to $2.90/MMBtu.

  • The price of the November 2023 NYMEX contract decreased from $3.377/MMBtu to $3.056/MMBtu.

  • Select regional spot prices showed varying price changes, with some locations experiencing increases.

Supply and Demand:

  • Total supply of natural gas increased by 1.1% compared to the previous week.

  • Dry natural gas production averaged 102.6 Bcf/d, reaching the highest weekly average since May 2023.

  • Total consumption of natural gas rose by 2.4% compared to the previous week.

  • Industrial sector consumption increased, and residential and commercial sector consumption surged due to cooler temperatures.

Liquefied Natural Gas (LNG):

  • Average natural gas deliveries to U.S. LNG export terminals increased by 12.2% week over week.

  • Vessels departing U.S. ports carried a total LNG-carrying capacity of 108 Bcf.

Rig Count:

  • The natural gas rig count decreased by one rig to 117 rigs, while the oil rig count increased by four rigs.

Storage Report Impact:

  • The weekly storage report led to a decline in natural gas prices, with the market dropping by 83 ticks.

Storage:

  • Net injections into storage totaled 97 Bcf for the week ending October 13, slightly above the five-year average.

  • Working natural gas stocks reached 3,626 Bcf, 5% higher than the five-year average and 9% more than last year at the same time.

The natural gas market is influenced by various factors, including production, consumption, and regional price variations. These insights are valuable for both industry experts and everyday consumers as they navigate the energy landscape. Stay tuned for the next update on October 26, 2023, to keep abreast of the latest developments in the natural gas market.

Source: https://www.eia.gov/naturalgas/weekly/


Start futures forex fx commodity news trading with Haawks G4A low latency machine-readable data, one of the fastest data feeds for DOE data.

Please let us know your feedback. If you are interested in timestamps, please send us an email to sales@haawks.com.

Comment

Share

Comment

Share

67 ticks potential profit in 60 seconds on 12 October 2023, analysis on futures forex fx news trading natural gas on DOE Natural Gas Storage Report data

According to our analysis natural gas moved 67 ticks on DOE Natural Gas Storage Report data on 12 October 2023.

Natural gas (67 ticks)

Charts are exported from JForex (Dukascopy).


In the Weekly Natural Gas Storage Report for the week ending October 6, 2023, it was revealed that working gas in underground storage in the Lower 48 states stood at 3,529 billion cubic feet (Bcf). This marked an increase of 84 Bcf from the previous week. Furthermore, current storage levels were 316 Bcf higher than the same period in the previous year and 163 Bcf above the five-year average of 3,366 Bcf. Despite these fluctuations, the total working gas volume of 3,529 Bcf remains within the historical five-year range. This report offers essential insights into the natural gas storage landscape, aiding in the assessment of trends and comparisons with historical data.

Source: https://ir.eia.gov/ngs/ngs.html


Start futures forex fx commodity news trading with Haawks G4A low latency machine-readable data, the fastest data feed for DOE data.

Please let us know your feedback. If you are interested in timestamps, please send us an email to sales@haawks.com.

Comment

Share

Comment

Share

28 ticks potential profit in 19 second on 31 August 2023, analysis on futures forex fx news trading natural gas on DOE Natural Gas Storage Report data

According to our analysis natural gas moved 28 ticks on DOE Natural Gas Storage Report data on 31 August 2023.

Start futures forex fx commodity news trading with Haawks G4A low latency machine-readable data, the fastest data feed for DOE data.

Please let us know your feedback. If you are interested in timestamps, please send us an email to sales@haawks.com.

Natural gas (28 ticks)

Charts are exported from JForex (Dukascopy).

For advanced petroleum analytics check out our partner OilX

Established in 2018, OilX combines the latest in advanced data science frameworks with extensive oil analytics knowledge to create the first real-time supply-demand balance tool. Headquartered in London, OilX has more than 15 years of oil analytics experience across oil majors, investment banks and hedge funds at the highest level.

For more information: www.oilx.co | LinkedIn: http://www.linkedin.com/company/oilx | Twitter: @OilXs

Comment

Share

Comment

Share

30 ticks potential profit in 40 second on 15 June 2023, analysis on futures forex fx news trading natural gas on DOE Natural Gas Storage Report data

According to our analysis natural gas moved 30 ticks on DOE Natural Gas Storage Report data on 15 June 2023.

Start futures forex fx commodity news trading with Haawks G4A low latency machine-readable data, the fastest data feed for DOE data.

Please let us know your feedback. If you are interested in timestamps, please send us an email to sales@haawks.com.

Natural gas (30 ticks)

Charts are exported from JForex (Dukascopy).

For advanced petroleum analytics check out our partner OilX

Established in 2018, OilX combines the latest in advanced data science frameworks with extensive oil analytics knowledge to create the first real-time supply-demand balance tool. Headquartered in London, OilX has more than 15 years of oil analytics experience across oil majors, investment banks and hedge funds at the highest level.

For more information: www.oilx.co | LinkedIn: http://www.linkedin.com/company/oilx | Twitter: @OilXs

Comment

Share

Comment

Share

17 ticks potential profit in 58 second on 9 February 2023, analysis on futures forex fx news trading natural gas on DOE Natural Gas Storage Report data

According to our analysis natural gas moved 17 ticks on DOE Natural Gas Storage Report data on 9 February 2023.

Start futures forex fx commodity news trading with Haawks G4A low latency machine-readable data, the fastest data feed for DOE data.

Please let us know your feedback. If you are interested in timestamps, please send us an email to sales@haawks.com.

Natural gas (17 ticks)

Charts are exported from JForex (Dukascopy).

For advanced petroleum analytics check out our partner OilX

Established in 2018, OilX combines the latest in advanced data science frameworks with extensive oil analytics knowledge to create the first real-time supply-demand balance tool. Headquartered in London, OilX has more than 15 years of oil analytics experience across oil majors, investment banks and hedge funds at the highest level.

For more information: www.oilx.co | LinkedIn: http://www.linkedin.com/company/oilx | Twitter: @OilXs

Comment

Share

Comment

Share

41 ticks potential profit in 16 second on 12 January 2023, analysis on futures forex fx news trading natural gas on DOE Natural Gas Storage Report data

According to our analysis natural gas moved 41 ticks on DOE Natural Gas Storage Report data on 12 January 2023.

Start futures forex fx commodity news trading with Haawks G4A low latency machine-readable data, the fastest data feed for DOE data.

Please let us know your feedback. If you are interested in timestamps, please send us an email to sales@haawks.com.

Natural gas (41 ticks)

Charts are exported from JForex (Dukascopy).

For advanced petroleum analytics check out our partner OilX

Established in 2018, OilX combines the latest in advanced data science frameworks with extensive oil analytics knowledge to create the first real-time supply-demand balance tool. Headquartered in London, OilX has more than 15 years of oil analytics experience across oil majors, investment banks and hedge funds at the highest level.

For more information: www.oilx.co | LinkedIn: http://www.linkedin.com/company/oilx | Twitter: @OilXs

Comment

Share