Viewing entries in
Forex News Trading

Comment

19 ticks potential profit in 93 seconds on 23 April 2025, analysis on futures news trading crude oil on DOE Petroleum Status Report data

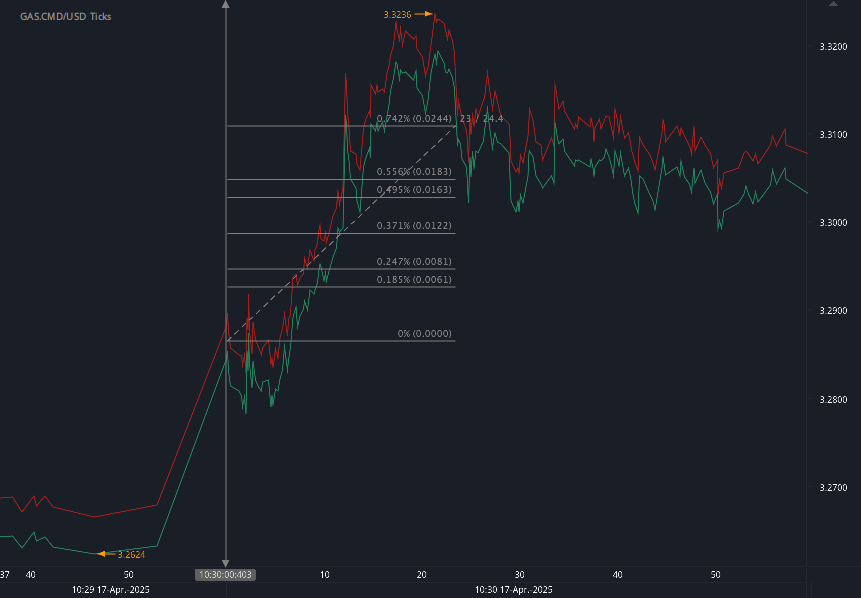
According to our analysis crude oil moved 19 ticks on DOE Petroleum Status Report data on 23 April 2025.

Light sweet crude oil (19 ticks)

Charts are exported from JForex (Dukascopy).


U.S. Weekly Petroleum Snapshot – April 18, 2025

The U.S. petroleum landscape for the week ending April 18, 2025, reveals a dynamic balance of supply, demand, and prices amid seasonal transitions and evolving energy trends. Let’s break down the latest Weekly Petroleum Status Report from the U.S. Energy Information Administration (EIA).

Refinery Operations and Output

U.S. crude oil refinery inputs averaged 15.9 million barrels per day, rising by 326,000 barrels per day compared to the previous week. Refineries operated at 88.1% of their operable capacity, reflecting an uptick as refineries ramp up ahead of peak driving season.

  • Gasoline production: Rose to 10.1 million barrels/day

  • Distillate fuel production: Dropped slightly to 4.6 million barrels/day

Imports and Inventories

Crude oil imports fell notably:

  • Crude imports: Dropped to 5.6 million barrels/day, down 412,000 from the previous week

  • Four-week average: 6.1 million barrels/day, 6.8% lower than last year

Meanwhile, inventory trends showed a mixed bag:

  • Crude oil inventories (excluding SPR): Up by 0.2 million barrels to 443.1 million barrels, still 5% below the five-year seasonal average

  • Gasoline inventories: Down 4.5 million barrels, now 3% below average

  • Distillate inventories: Down 2.4 million barrels, a significant 13% below average

  • Propane/propylene: Up 2.3 million barrels, but 7% below average

  • Total commercial petroleum inventories: Declined 0.7 million barrels

Product Demand

Demand remained relatively strong:

  • Total products supplied: Averaged 19.9 million barrels/day, up 0.4% year-over-year

  • Gasoline supplied: 8.7 million barrels/day, slightly down (0.4%) from last year

  • Distillate fuel supplied: 3.9 million barrels/day, up a robust 12.8%

  • Jet fuel supplied: Surged 13.8%, signaling increased air travel demand

Retail Fuel Prices

Prices continued their downward trend:

  • Regular gasoline: Averaged $3.141/gallon, down $0.027 from last week and $0.527 below last year

  • Diesel fuel: Averaged $3.534/gallon, down $0.045 week-over-week and $0.458 below year-ago levels

Looking Ahead

The report suggests a seasonal tightening in gasoline inventories even as production ramps up. Meanwhile, strong distillate and jet fuel demand reflects broader economic activity. Retail fuel prices remain considerably lower than in 2024, which could support continued consumer travel and freight movement into the summer.

Refiners appear to be preparing for peak season with increased utilization and production. However, below-average inventories in key product categories may make markets more sensitive to disruptions or spikes in demand.

Conclusion With gasoline inventories dropping and demand for jet and distillate fuels rising sharply, all eyes are on how refiners and importers respond heading into summer. Continued lower prices at the pump are welcome news for consumers, though tightening supply conditions warrant close monitoring.

Disclaimer: This blog post is for informational purposes only and should not be construed as financial advice. Always conduct thorough research and consider seeking advice from a financial professional before making any investment decisions.

Source: https://www.eia.gov/petroleum/supply/weekly/archive/2025/2025_04_23/pdf/highlights.pdf


Start futures forex fx commodity news trading with Haawks G4A low latency machine-readable data, one of the fastest data feeds for DOE data.

Please let us know your feedback. If you are interested in timestamps, please send us an email to sales@haawks.com.

Comment

Comment

24 ticks potential profit in 23 seconds on 17 April 2025, analysis on futures news trading natural gas on DOE Natural Gas Storage Report data

According to our analysis natural gas moved 24 ticks on DOE Natural Gas Storage Report data on 17 April 2025.

Natural gas (24 ticks)

Charts are exported from JForex (Dukascopy).


Natural Gas Market Update: Prices Decline Despite Regional Spikes and Supply Constraints
Week Ending April 16, 2025

This past week in the natural gas market saw a notable divergence between national and regional pricing trends, slight shifts in supply and demand dynamics, and continued robust activity in liquefied natural gas (LNG) exports.

Price Trends: National Benchmarks Down, Regional Prices Mixed

Henry Hub Prices:
The benchmark Henry Hub spot price dropped by $0.22, settling at $3.21/MMBtu. Futures prices followed suit, with the May 2025 NYMEX contract falling $0.57 to $3.247/MMBtu. The 12-month strip (May 2025–April 2026) also declined $0.34 to average $3.929/MMBtu.

Regional Spot Markets:
Spot price movements were varied. While the Algonquin Citygate saw a steep $0.66 drop, the Northwest Sumas hub surged $1.01 to $1.82/MMBtu, driven by cooler temperatures and a temporary outage at the Columbia Nuclear Generating Station. Southern California's SoCal Citygate also saw a $0.23 increase, coinciding with warmer weather and elevated cooling demand.

International LNG Markets:
East Asian LNG prices fell $0.45 to $12.40/MMBtu, while Dutch TTF futures dropped $0.39 to $11.35/MMBtu. Despite these decreases, both markets remain well above their year-ago levels.

Supply and Demand Dynamics

Supply:
Total U.S. natural gas supply dipped slightly by 0.1% to 106.3 Bcf/d. Dry production increased by 0.5 Bcf/d, but net imports from Canada fell 9.3%, or 0.6 Bcf/d—impacted in part by reduced flows into the Pacific Northwest.

Demand:
Overall consumption fell 6.9%, with the most significant drop in the residential/commercial sector (-14.1%). Power generation demand declined 5.4%, and industrial use slipped 1.4%. Exports to Mexico fell by 3.6%, while LNG feed gas deliveries rose modestly by 0.2 Bcf/d to 16.8 Bcf/d.

LNG Activity Remains Strong

Thirty-four LNG vessels departed U.S. terminals between April 10 and April 16, carrying a total capacity of 129 Bcf. Sabine Pass led departures with 10 vessels. Deliveries to South Louisiana terminals increased, while South Texas saw a minor decline.

Storage Levels Lag Behind Seasonal Norms

Net injections into storage were 16 Bcf—well below the five-year average of 50 Bcf and last year’s 46 Bcf. Total working stocks now sit at 1,846 Bcf, marking a 4% deficit against the five-year average and a 21% shortfall year-over-year.

Rig Count Shows Slight Rebalancing

The natural gas rig count rose by one to 97. Regional shifts included a gain in Haynesville and a drop in the Marcellus. The overall rig count (including oil and miscellaneous) fell to 583, down 34 from a year ago.

Conclusion:
Despite seasonal shifts in weather and slight production gains, the natural gas market continues to feel pressure from subdued demand and underwhelming storage injections. While regional price volatility reflects localized supply issues and temperature-driven demand, national and international markets are trending downward—pointing to a cautious short-term outlook.

Disclaimer: This blog post is for informational purposes only and should not be construed as financial advice. Always conduct thorough research and consider seeking advice from a financial professional before making any investment decisions.

Source: https://www.eia.gov/naturalgas/weekly/archivenew_ngwu/2025/04_17/


Start futures forex fx commodity news trading with Haawks G4A low latency machine-readable data, one of the fastest data feeds for DOE data.

Please let us know your feedback. If you are interested in timestamps, please send us an email to sales@haawks.com.

Comment

Comment

29 ticks potential profit in 29 seconds on 9 April 2025, analysis on futures news trading crude oil on DOE Petroleum Status Report data

According to our analysis crude oil moved 29 ticks on DOE Petroleum Status Report data on 9 April 2025.

Light sweet crude oil (29 ticks)

Charts are exported from JForex (Dukascopy).


U.S. Petroleum Market Snapshot – Week Ending April 4, 2025

The U.S. Energy Information Administration’s latest Weekly Petroleum Status Report offers a detailed overview of refinery activity, inventory shifts, import levels, and product supply trends. The data highlights a broadly steady refining environment with subtle but important changes in stock levels and product flows.

Refinery Activity

During the week ending April 4, 2025, U.S. crude oil refinery inputs averaged 15.6 million barrels per day. This represents a slight increase of 69,000 barrels per day compared to the previous week. Refineries operated at 86.7% of operable capacity, nearly unchanged from the prior week's 86.6%, but lower than the 88.3% level recorded during the same period last year.

Production of key refined products showed a week-over-week decline. Motor gasoline production averaged 8.9 million barrels per day, while distillate fuel oil production averaged 4.7 million barrels per day—both lower than the previous week’s figures and also below year-ago levels.

Crude Oil and Product Imports

U.S. crude oil imports averaged 6.2 million barrels per day, a decrease of 277,000 barrels per day from the prior week. Over the last four weeks, imports have averaged 6.1 million barrels per day, 6.9% less than during the same period last year.

Motor gasoline imports last week averaged 778,000 barrels per day, while distillate fuel imports came in at 69,000 barrels per day.

Net imports over the past four weeks averaged:

  • Crude oil: 1.96 million barrels per day

  • Petroleum products: -4.95 million barrels per day

  • Total: -2.98 million barrels per day

Inventory Changes

Commercial crude oil inventories, excluding those in the Strategic Petroleum Reserve (SPR), increased by 2.6 million barrels, reaching a total of 442.3 million barrels. This level is approximately 5% below the five-year average for this time of year.

Motor gasoline inventories decreased by 1.6 million barrels to 236.0 million barrels, which is in line with the five-year average. Within that category, finished gasoline stocks increased, while blending component inventories decreased.

Distillate fuel inventories dropped significantly, falling by 3.5 million barrels to 111.1 million barrels. These inventories are now about 9% below the five-year average. Propane/propylene inventories rose by 1.5 million barrels but remain 5% below the seasonal norm.

Total commercial petroleum inventories increased modestly by 1.2 million barrels over the week.

Product Supplied

The four-week average for total products supplied—a proxy for demand—was 19.6 million barrels per day, down 1.9% compared to the same period last year.

Motor gasoline product supplied averaged 8.6 million barrels per day over the past four weeks, down 2.8% from the same period last year. In contrast, distillate fuel oil product supplied rose by 7.3% to 3.8 million barrels per day. Jet fuel product supplied also increased, up 5.2% year-over-year.

This data reflects ongoing structural shifts in supply and demand across key fuel categories and underscores the importance of monitoring both production levels and inventory trends.

Disclaimer: This blog post is for informational purposes only and should not be construed as financial advice. Always conduct thorough research and consider seeking advice from a financial professional before making any investment decisions.

Source: https://www.eia.gov/petroleum/supply/weekly/archive/2025/2025_04_09/pdf/highlights.pdf


Start futures forex fx commodity news trading with Haawks G4A low latency machine-readable data, one of the fastest data feeds for DOE data.

Please let us know your feedback. If you are interested in timestamps, please send us an email to sales@haawks.com.

Comment

Comment

27 ticks potential profit in 26 seconds on 3 April 2025, analysis on futures forex fx news trading natural gas on DOE Natural Gas Storage Report data

According to our analysis natural gas moved 27 ticks on DOE Natural Gas Storage Report data on 3 April 2025.

Natural gas (27 ticks)

Charts are exported from JForex (Dukascopy).


Weekly Natural Gas Storage Report: Bearish Signal as Storage Builds, Prices Slip

Published April 5, 2025

Natural Gas Slips as Storage Climbs—Is a Bearish Trend Setting In?

Traders keeping a close eye on the EIA's Weekly Natural Gas Storage Report just got a fresh signal—and it’s leaning bearish.

For the week ending March 28, 2025, working gas in storage across the Lower 48 increased by 29 Bcf, bringing total inventories to 1,773 Bcf. This marks a steady build from the prior week’s 1,744 Bcf and sends a clear message: demand isn’t outpacing supply just yet.

The market reacted accordingly—natural gas futures slid 27 ticks on the report release. With warmer spring temps starting to roll in and injection season underway, traders are now weighing the potential for additional downside in the weeks ahead.

Key Takeaways from the Report:

  • Total Storage: 1,773 Bcf (+29 Bcf week-over-week)

  • Year-over-Year Deficit: -491 Bcf vs. March 28, 2024

  • 5-Year Average Gap: -80 Bcf

  • Regions Seeing Gains:

    • South Central led with a 33 Bcf build

    • Pacific and Mountain regions also saw increases

  • Declines Noted:

    • East (-14 Bcf) and Midwest (-3 Bcf) showed drawdowns, but not enough to offset overall builds

What This Means for Traders:

Despite inventories still being below the 5-year average, the consistent builds—and especially the strength from the South Central region—are signaling a pivot from withdrawal season into a more storage-heavy pattern. That’s typically bearish unless unexpected weather shifts or LNG exports shake up demand.

The fact that natural gas dropped 27 ticks post-release reinforces that sentiment. Traders are likely seeing this as confirmation that supply is adequate for now.

Price Action & Market Outlook:

This 27-tick drop could be the start of a broader move if upcoming reports show continued builds. With total stocks still within the 5-year historical range, the downside may have room to run unless production slows or cooling demand picks up unexpectedly.

Watchlist for Next Week:

  • April 10, 2025: Next storage report

  • Weather forecasts—any late-season cold could shift the tone

  • LNG export data—still a wild card for demand strength

Source: https://ir.eia.gov/ngs/ngs.html


Start futures forex fx commodity news trading with Haawks G4A low latency machine-readable data, one of the fastest data feeds for DOE data.

Please let us know your feedback. If you are interested in timestamps, please send us an email to sales@haawks.com.

Comment

Comment

21 pips potential profit in 24 seconds on 1 April 2025, analysis on futures forex fx news trading EURUSD and USDJPY on US BLS Job Openings and Labor Turnover Survey (JOLT)

According to our analysis USDJPY and EURUSD moved 21 pips on US BLS Job Openings and Labor Turnover Survey (JOLT) data on 1 April 2025.

USDJPY (17 pips)

EURUSD (4 pips)

Charts are exported from JForex (Dukascopy).


JOLTS Report Breakdown – What February 2025 Tells Traders About the Labor Market

The latest Job Openings and Labor Turnover Survey (JOLTS) report dropped this morning, and while the headline summary says “little changed,” the details tell a more nuanced story for markets.

For February 2025:

  • Job Openings: 7.6 million (down 194,000 month-over-month, down 877,000 year-over-year)

  • Hires: 5.4 million (unchanged)

  • Total Separations: 5.3 million (unchanged)

  • Quits: 3.2 million (unchanged, down 273,000 year-over-year)

  • Layoffs & Discharges: 1.8 million (unchanged)

Here’s what it all means from a trading lens:

1. Job Openings Decline Continues
Job openings fell by 194,000 in February following a slight upward revision to January’s number. That’s nearly 900,000 fewer openings compared to a year ago. At 4.5%, the openings rate suggests employer demand is still solid but cooling.

Market Implication:
This labor market softening supports a dovish tilt from the Fed. A slower pace of hiring demand should help temper wage inflation, giving rate-cut narratives more traction. Expect continued strength in bonds and growth equities if this trend holds.

2. Quits Rate Remains Low
At 2.0%, the quits rate hasn’t budged. Workers still aren’t leaving jobs like they were a year ago, which points to reduced job-hopping confidence and easing wage pressures.

Market Implication:
Wage growth moderation is a positive signal for inflation control. This is especially bullish for duration-sensitive assets, including tech, Treasuries, and REITs.

3. Layoffs Up in Retail and Real Estate
The total number of layoffs and discharges held steady overall, but under the hood, key sectors saw increases:

  • Retail Trade: +67,000

  • Real Estate and Leasing: +24,000

  • Federal Government: +18,000

  • Transportation/Warehousing: -42,000 (a notable decline)

Market Implication:
Weakness in retail and real estate may translate into pressure on consumer and housing stocks. But fewer layoffs in transportation could support cyclical or industrial names.

4. Small Business Labor Pressure
Firms with 1–9 employees saw a decrease in quits and other separations but an increase in layoffs/discharges—hinting at mounting strain in the small business segment.

Market Implication:
Small caps and regional banks could feel more pressure if this continues. Keep an eye on the Russell 2000 and credit-sensitive financials.

5. January Revisions Worth Watching

  • Job openings revised up to 7.8M

  • Hires revised down by 22K

  • Quits revised down by 10K

  • Layoffs revised up by 39K

Market Implication:
While the revisions are modest, they reinforce the theme of a gradually softening labor market. That may strengthen the argument for Fed cuts if this trajectory continues.

Looking Ahead
The next JOLTS report (for March) lands April 29—right before the next FOMC meeting. If labor demand and confidence continue sliding, expect the market to more aggressively price in rate cuts for mid-2025.

Source: https://www.bls.gov/news.release/jolts.nr0.htm


Start futures #forex fx news #trading with Haawks G4A low latency machine-readable data today, one of the fastest news data feeds for US macro-economic and commodity data.

Please let us know your feedback. If you are interested in timestamps, please send us an email to sales@haawks.com.

Comment

Comment

US30 154 points and BTC 592 points potential profit in 12 seconds on 14 March 2025, analysis on futures forex fx low latency news trading US30 and BTC Bitcoin on Michigan Consumer Sentiment

According to our analysis US30 moved 154 points and BTC 592 points on University Michigan Consumer Sentiment / Inflation Expectations data on 14 March 2025.

US30 (154 points)

BTC (592 points)

Charts are exported from JForex (Dukascopy).


Market Sentiment Crashes: What Traders Need to Know

March 2025 has delivered another major blow to consumer sentiment, marking the third consecutive month of decline. According to the preliminary data, the Index of Consumer Sentiment dropped 10.5% from February and a staggering 27.1% year-over-year. Economic uncertainty continues to rattle consumers and traders alike, with ripple effects visible across the markets.

Key Takeaways:

  • Consumer sentiment plunged to 57.9, down from 64.7 in February and 79.4 a year ago.

  • Economic expectations deteriorated sharply, with the Index of Consumer Expectations plummeting 15.3% month-over-month and 30.0% year-over-year.

  • Year-ahead inflation expectations surged to 4.9%, up from 4.3% last month, the highest reading since November 2022.

  • Long-run inflation expectations spiked to 3.9%, marking the biggest monthly jump since 1993.

  • Market reactions: The Dow Jones Industrial Average (US30) dropped 154 points, while Bitcoin (BTC) fell 592 points.

Breaking Down the Market Impact

Equities Market: Bearish Momentum Persists

Consumer sentiment is often a leading indicator of market performance, and the latest data suggests continued weakness. The 154-point drop in the Dow underscores mounting concerns about economic uncertainty and inflationary pressures.

Key sectors to watch:

  • Retail & Consumer Goods: With sentiment tumbling, discretionary spending could take a hit. Watch out for bearish trends in companies reliant on consumer confidence, such as major retailers and automakers.

  • Financials: Rising inflation expectations could push interest rates higher, impacting lending and borrowing costs. Banks may see short-term gains but long-term risks.

  • Technology: Growth stocks, particularly those sensitive to interest rate movements, may experience increased volatility.

Crypto Market: BTC’s Decline Reflects Risk Aversion

Bitcoin’s 592-point drop aligns with the broader trend of risk-off sentiment. Higher inflation expectations can lead to more aggressive monetary tightening, reducing liquidity and dampening demand for speculative assets like crypto. Traders should watch for:

  • Support Levels: BTC needs to hold key technical levels to prevent further downside pressure.

  • Macroeconomic Cues: Any hawkish signals from central banks could exacerbate selling pressure.

  • Altcoin Correlations: The broader crypto market tends to follow BTC’s lead, so caution is warranted across the board.

Trading Strategies in a Volatile Environment

Short-Term Plays:

  • Hedge Against Inflation: Consider commodities such as gold and energy stocks, which often perform well in inflationary environments.

  • Short Weak Sectors: Retail, consumer discretionary, and high-growth tech stocks may struggle in the current climate.

  • Play the Volatility: Options strategies like straddles or strangles could be useful given heightened uncertainty.

Long-Term Positioning:

  • Defensive Stocks: Sectors like healthcare, utilities, and consumer staples tend to be more resilient during economic downturns.

  • Dividend Payers: Stocks with strong dividend yields can provide stability amidst market turbulence.

  • Crypto Accumulation: If BTC continues to correct, long-term holders might find opportunities to buy on dips.

What’s Next?

The final March sentiment report is set for release on March 28, 2025. Until then, expect continued volatility as traders digest the latest data. The biggest wild card remains policy uncertainty—any shifts in fiscal or monetary policy could further disrupt market stability. Keep a close eye on inflation trends, central bank actions, and earnings reports for guidance on the next moves.

Stay sharp, stay hedged, and trade smart!

Disclaimer: This blog post is for informational purposes only and should not be construed as financial advice. Always conduct thorough research and consider seeking advice from a financial professional before making any investment decisions.

Source: http://www.sca.isr.umich.edu


Start futures and forex fx news trading with Haawks G4A low latency machine-readable data, one of the fastest machine-readable news trading feeds for US macro-economic and commodity data.

Please let us know your feedback. If you are interested in timestamps, please send us an email to sales@haawks.com.

Comment

Comment

20 pips and BTC 280 points potential profit in 218 seconds on 14 Februar 2025, analysis on futures forex fx news trading USDJPY and BTC on US Retail Sales data

According to our analysis USDJPY and BTC moved 20 pips and 280 points on US Retail Sales data on 14 February 2025.

USDJPY (20 pips)

BTC (280 points)

Charts are exported from JForex (Dukascopy).


Market Reaction: USD/JPY Drops, Bitcoin Rallies After Weak Retail Sales Data

📅 February 14, 2025

The latest U.S. retail sales report has sent ripples through financial markets, causing USD/JPY to drop 20 pips while Bitcoin surged 280 points. With traders reacting swiftly to the data, let’s break down what’s happening and how you can capitalize on the volatility.

📉 USD/JPY Falls 20 Pips – Weak U.S. Data Weighs on Dollar

The U.S. retail and food services sales for January fell 0.9% from December, worse than market expectations. While still up 4.2% YoY, the weaker month-over-month figure has sparked concerns about consumer spending trends.

💡 Market Reaction:

  • The dollar weakened as traders reassess Fed rate cut expectations—a slowdown in retail activity could push the Fed to ease sooner.

  • USD/JPY fell 20 pips as demand for the safe-haven yen increased.

  • U.S. Treasury yields ticked lower, signaling growing expectations of monetary easing.

🚀 Bitcoin Rallies 280 Points – Risk-On Sentiment Creeping Back?

Bitcoin surged 280 points following the report, as traders bet on softer economic data fueling rate cut speculation. With lower rates favoring risk assets, BTC has resumed its upward momentum.

📢 Final Thoughts

Today’s retail sales report has triggered FX and crypto volatility, with USD/JPY sliding and Bitcoin soaring. As traders digest the data, all eyes will be on Fed policy signals and risk sentiment in the coming days.

🚀 What’s your move? Are you shorting USD/JPY or riding the BTC rally? Drop your strategy in the comments!

Disclaimer: This blog post is for informational purposes only and should not be construed as financial advice. Always conduct thorough research and consider seeking advice from a financial professional before making any investment decisions.

Source: https://www.census.gov/retail/sales.html


Please let us know your feedback. If you are interested in timestamps, please send us an email to sales@haawks.com.

Start futures forex fx news trading with Haawks G4A low latency machine-readable data today, one of the fastest news data feeds for US macro-economic and commodity data.

Comment

Comment

23 pips, US30 147 points and BTC 1279 points potential profit in 32 seconds on 12 February 2025, analysis on futures forex fx low latency news trading USDJPY on US Consumer Price Index (CPI)

According to our analysis USDJPY moved 23 pips, US30 moved 147 points and Bitcoin (BTC) moved 1279 points on US BLS Consumer Price Index (CPI) data on 12 February 2025.

USDJPY (23 pips)

US30 (147 points)

Bitcoin BTC (1279 points)

Charts are exported from JForex (Dukascopy).


CPI Report Shakes Markets: USD/JPY Gains, US30 Drops, BTC Dips

The January 2025 Consumer Price Index (CPI) report released by the Bureau of Labor Statistics showed a higher-than-expected inflation increase of 0.5% month-over-month, bringing the annual CPI to 3.0%. This data immediately sent ripples through the financial markets, impacting major asset classes, including forex, equities, and crypto.

Key CPI Highlights:

  • Headline CPI: +0.5% (MoM), +3.0% (YoY)

  • Core CPI (Ex-Food & Energy): +0.4% (MoM), +3.3% (YoY)

  • Shelter Costs: +0.4% MoM, a major driver of inflation

  • Energy Index: +1.1% MoM, fueled by a 1.8% increase in gasoline prices

  • Food Index: +0.4% MoM, with food-at-home prices up 0.5%

Market Reaction:

Forex – USD/JPY Rises 23 Pips

The U.S. dollar strengthened against the Japanese yen, with USD/JPY climbing 23 pips post-release. This move reflects increased expectations that the Federal Reserve may need to maintain higher interest rates for longer to combat inflation. The resilience of core CPI above 3.0% further solidifies the Fed’s hawkish stance, making USD more attractive compared to JPY, which remains under the Bank of Japan’s ultra-loose policy.

Equities – US30 Drops 147 Points

Wall Street reacted negatively to the inflation data, with the Dow Jones Industrial Average (US30) falling 147 points. Investors are concerned that persistent inflation may delay any potential Fed rate cuts, dampening risk appetite. Additionally, rising costs for shelter and transportation services indicate that consumer spending power could take a hit, affecting corporate earnings.

Crypto – Bitcoin Drops 1,279 Points

Bitcoin (BTC) saw a sharp decline of 1,279 points following the CPI release, reflecting a risk-off sentiment in the broader market. Higher-than-expected inflation led to speculation that Fed policy will remain tight, reducing liquidity for riskier assets like crypto. BTC’s drop also aligns with a broader sell-off in tech and growth stocks, which tend to be more sensitive to interest rate outlooks.

Final Thoughts

Traders should brace for continued volatility as inflation concerns linger. The next major catalyst will be the Fed’s response in upcoming meetings and market reactions to any further economic data releases. Stay alert to potential breakout moves in USD/JPY, US30, and BTC as inflation trends develop.

Disclaimer: This blog post is for informational purposes only and should not be construed as financial advice. Always conduct thorough research and consider seeking advice from a financial professional before making any investment decisions.

Source: https://www.bls.gov/news.release/cpi.nr0.htm


Start futures forex fx news trading with Haawks G4A low latency machine-readable data, one of the fastest machine-readable news trading feed for US macro-economic and commodity data.

Please let us know your feedback. If you are interested in timestamps, please send us an email to sales@haawks.com.

Comment

Comment

14 pips, US30 144 points and BTC 739 points potential profit in 176 seconds on 7 February 2025, analysis on futures forex fx low latency news trading USDJPY and EURUSD on Michigan Consumer Sentiment

According to our analysis USDJPY and EURUSD moved 14 pips, US30 moved 144 points and BTC 739 points on University Michigan Consumer Sentiment / Inflation Expectations data on 7 February 2025.

USDJPY (7 pips)

EURUSD (7 pips)

US30 (144 points)

BTC (739 points)

Charts are exported from JForex (Dukascopy).


Markets React to Consumer Sentiment Drop: US30 & BTC Decline

The preliminary consumer sentiment data for February 2025 came in lower than expected, triggering a broad risk-off sentiment across financial markets. The US30 (Dow Jones Industrial Average) and Bitcoin (BTC) both moved lower following the release, as traders reacted to rising inflation fears and weakening economic confidence.

Consumer Sentiment Declines for a Second Month

The Index of Consumer Sentiment fell to 67.8, marking a 4.6% decline from January and an 11.8% drop year-over-year. This drop represents the lowest level since July 2024 and reflects growing concerns over economic conditions, inflation, and future expectations.

The Current Economic Conditions index fell even further, down 7.2% month-over-month and 13.5% from last year, showing that consumers are increasingly cautious about spending. Meanwhile, the Index of Consumer Expectations declined 2.9% month-over-month and 10.5% year-over-year, signaling growing pessimism about the future economic landscape.

Market Reaction: US30 (Dow) Pulls Back

US equities, particularly the Dow Jones (US30), reacted negatively to the report. With consumer sentiment weakening, concerns over slowing economic growth and the impact of tariffs on durable goods purchases added downward pressure on stocks.

  • Buying conditions for durable goods fell by 12%, reinforcing concerns that consumer demand may weaken.

  • Inflation expectations jumped from 3.3% to 4.3%, raising fears that the Federal Reserve might have to keep interest rates higher for longer.

  • The market had been pricing in potential rate cuts later in the year, but rising inflation expectations complicate that outlook, leading to a sell-off in equities.

Bitcoin (BTC) Also Takes a Hit

Bitcoin, often seen as a hedge against inflation, has struggled to find bullish momentum in this environment. BTC dropped in tandem with equities, signaling that risk-off sentiment has spilled over into the crypto market.

  • Rising inflation concerns can sometimes benefit Bitcoin as a hedge, but if interest rates stay high for longer, it diminishes the appeal of speculative assets like BTC.

  • A decline in consumer sentiment and economic confidence could lead to reduced liquidity in financial markets, limiting Bitcoin’s upside in the short term.

  • Bitcoin has been trading in a tight range, and this sentiment-driven dip could push prices toward key support levels.

Looking Ahead: Key Levels to Watch

With final February consumer sentiment data set to be released on February 21, traders will be closely watching whether the trend worsens or stabilizes. Additionally, any new comments from the Federal Reserve on inflation expectations and interest rates will heavily influence market direction.

Conclusion: A Cautious Trading Environment

The sharp drop in consumer sentiment and rising inflation expectations have created uncertainty for both traditional and crypto markets. As traders assess the evolving macroeconomic landscape, volatility is likely to remain high. Risk management will be crucial in the coming weeks as markets digest incoming economic data and central bank policy signals.

For now, sentiment remains fragile, and traders should stay alert to any further deterioration in economic indicators that could fuel additional downside pressure in both US30 and BTC.

Source: http://www.sca.isr.umich.edu


Start futures and forex fx news trading with Haawks G4A low latency machine-readable data, one of the fastest machine-readable news trading feeds for US macro-economic and commodity data.

Please let us know your feedback. If you are interested in timestamps, please send us an email to sales@haawks.com.

Comment

Comment

15 pips and US30 26 points potential profit in 26 seconds on 4 February 2025, analysis on futures forex fx news trading EURUSD and USDJPY on US BLS Job Openings and Labor Turnover Survey (JOLT) data

According to our analysis USDJPY and EURUSD moved 15 pips and US30 moved 26 points on US BLS Job Openings and Labor Turnover Survey (JOLT) data on 4 February 2025.

USDJPY (9 pips)

EURUSD (6 pips)

US30 (26 points)

Charts are exported from JForex (Dukascopy).


Job Openings and Labor Turnover: What Traders Need to Know

The latest Job Openings and Labor Turnover Survey (JOLTS) report from the Bureau of Labor Statistics (BLS) offers key insights into the U.S. labor market for December 2024. With job openings declining, hiring slowing, and layoffs rising in certain sectors, traders should closely analyze these trends to anticipate market movements.

Key Takeaways for Traders

1. Job Openings Drop to 7.6 Million

  • December saw a decrease of 556,000 job openings, bringing the total to 7.6 million.

  • This marks a 1.3 million decline over the year, indicating a cooling labor market.

  • Sectors Hit Hardest:

    • Professional and business services (-225,000)

    • Healthcare and social assistance (-180,000)

    • Finance and insurance (-136,000)

  • Sector Showing Growth:

    • Arts, entertainment, and recreation (+65,000)

  • Trader Insight: A declining job openings rate (now at 4.5%) suggests economic slowdown, which could weigh on consumer spending and corporate earnings.

2. Hiring Activity Remains Weak

  • The number of hires in December remained flat at 5.5 million, down 325,000 year-over-year.

  • Hiring in finance and insurance increased by 48,000, which may indicate resilience in this sector.

  • Trader Insight: Weak hiring points to softening corporate growth and potential downward pressure on equities, particularly in sectors with job losses.

3. Separations: Layoffs vs. Quits

  • Total separations (quits, layoffs, discharges) held steady at 5.3 million.

  • Quits Rate:

    • 2.0% (unchanged)

    • Total quits fell by 242,000 YoY, showing reduced worker confidence.

    • Quits declined in transportation, warehousing, and utilities (-42,000), suggesting slowing activity in logistics.

  • Layoffs & Discharges:

    • Increased in transportation, warehousing, and utilities (+87,000).

    • Increased in mining and logging (+6,000).

  • Trader Insight: Rising layoffs in transportation and warehousing could signal slowing global trade, negatively impacting companies in shipping, logistics, and e-commerce.

Market Implications

Equities:

  • Bearish: Sectors seeing major job losses (finance, healthcare, business services) may face weaker earnings.

  • Bullish: Companies in entertainment and recreation show hiring growth, suggesting some resilience in consumer discretionary spending.

Fixed Income:

  • A softening labor market could lead to increased Federal Reserve dovishness, supporting lower bond yields and a rally in Treasuries.

FX Markets:

  • Dollar Weakness? A weakening job market might prompt a less aggressive Fed, potentially denting USD strength.

  • Safe Haven Flows: If economic slowdown fears grow, expect flows into JPY and CHF.

Commodities:

  • Oil Impact: Increased layoffs in transportation and logistics suggest potential demand weakness, which could weigh on crude prices.

  • Gold Strength: Rising economic uncertainty may drive safe-haven demand for gold.

Looking Ahead: January 2025 Report

The next JOLTS report (January 2025) will be released on March 11, 2025. Traders should monitor labor market trends alongside inflation data, GDP growth, and Fed policy shifts for a broader market outlook.

Bottom Line: A cooling labor market is a warning signal for traders. Weaker hiring, falling job openings, and increasing layoffs point to slower economic growth—a potential headwind for risk assets. Stay ahead by adjusting strategies accordingly!

Disclaimer: This blog post is for informational purposes only and should not be construed as financial advice. Always conduct thorough research and consider seeking advice from a financial professional before making any investment decisions.

Source: https://www.bls.gov/news.release/jolts.nr0.htm


Start futures #forex fx news #trading with Haawks G4A low latency machine-readable data today, one of the fastest news data feeds for US macro-economic and commodity data.

Please let us know your feedback. If you are interested in timestamps, please send us an email to sales@haawks.com.

Comment