Blog — HAAWKS

Viewing entries by
Pierre

Comment

Share

15 pips and US30 26 points potential profit in 26 seconds on 4 February 2025, analysis on futures forex fx news trading EURUSD and USDJPY on US BLS Job Openings and Labor Turnover Survey (JOLT) data

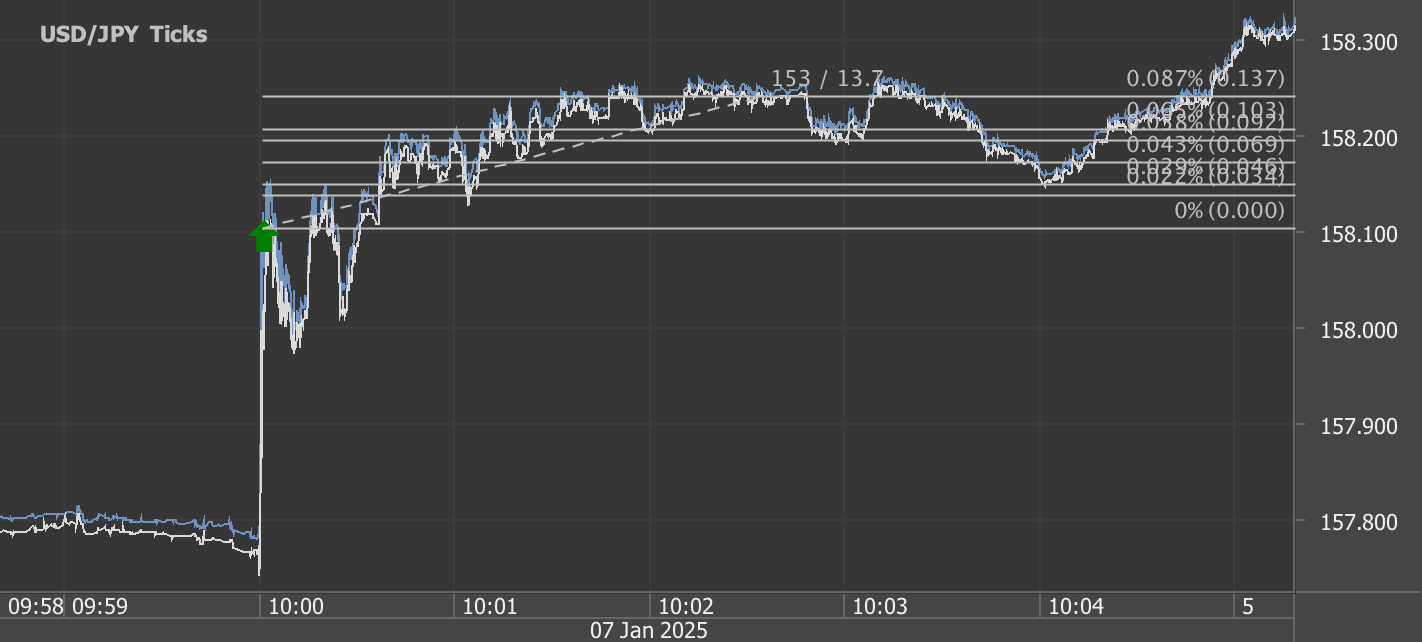
According to our analysis USDJPY and EURUSD moved 15 pips and US30 moved 26 points on US BLS Job Openings and Labor Turnover Survey (JOLT) data on 4 February 2025.

USDJPY (9 pips)

EURUSD (6 pips)

US30 (26 points)

Charts are exported from JForex (Dukascopy).


Job Openings and Labor Turnover: What Traders Need to Know

The latest Job Openings and Labor Turnover Survey (JOLTS) report from the Bureau of Labor Statistics (BLS) offers key insights into the U.S. labor market for December 2024. With job openings declining, hiring slowing, and layoffs rising in certain sectors, traders should closely analyze these trends to anticipate market movements.

Key Takeaways for Traders

1. Job Openings Drop to 7.6 Million

  • December saw a decrease of 556,000 job openings, bringing the total to 7.6 million.

  • This marks a 1.3 million decline over the year, indicating a cooling labor market.

  • Sectors Hit Hardest:

    • Professional and business services (-225,000)

    • Healthcare and social assistance (-180,000)

    • Finance and insurance (-136,000)

  • Sector Showing Growth:

    • Arts, entertainment, and recreation (+65,000)

  • Trader Insight: A declining job openings rate (now at 4.5%) suggests economic slowdown, which could weigh on consumer spending and corporate earnings.

2. Hiring Activity Remains Weak

  • The number of hires in December remained flat at 5.5 million, down 325,000 year-over-year.

  • Hiring in finance and insurance increased by 48,000, which may indicate resilience in this sector.

  • Trader Insight: Weak hiring points to softening corporate growth and potential downward pressure on equities, particularly in sectors with job losses.

3. Separations: Layoffs vs. Quits

  • Total separations (quits, layoffs, discharges) held steady at 5.3 million.

  • Quits Rate:

    • 2.0% (unchanged)

    • Total quits fell by 242,000 YoY, showing reduced worker confidence.

    • Quits declined in transportation, warehousing, and utilities (-42,000), suggesting slowing activity in logistics.

  • Layoffs & Discharges:

    • Increased in transportation, warehousing, and utilities (+87,000).

    • Increased in mining and logging (+6,000).

  • Trader Insight: Rising layoffs in transportation and warehousing could signal slowing global trade, negatively impacting companies in shipping, logistics, and e-commerce.

Market Implications

Equities:

  • Bearish: Sectors seeing major job losses (finance, healthcare, business services) may face weaker earnings.

  • Bullish: Companies in entertainment and recreation show hiring growth, suggesting some resilience in consumer discretionary spending.

Fixed Income:

  • A softening labor market could lead to increased Federal Reserve dovishness, supporting lower bond yields and a rally in Treasuries.

FX Markets:

  • Dollar Weakness? A weakening job market might prompt a less aggressive Fed, potentially denting USD strength.

  • Safe Haven Flows: If economic slowdown fears grow, expect flows into JPY and CHF.

Commodities:

  • Oil Impact: Increased layoffs in transportation and logistics suggest potential demand weakness, which could weigh on crude prices.

  • Gold Strength: Rising economic uncertainty may drive safe-haven demand for gold.

Looking Ahead: January 2025 Report

The next JOLTS report (January 2025) will be released on March 11, 2025. Traders should monitor labor market trends alongside inflation data, GDP growth, and Fed policy shifts for a broader market outlook.

Bottom Line: A cooling labor market is a warning signal for traders. Weaker hiring, falling job openings, and increasing layoffs point to slower economic growth—a potential headwind for risk assets. Stay ahead by adjusting strategies accordingly!

Disclaimer: This blog post is for informational purposes only and should not be construed as financial advice. Always conduct thorough research and consider seeking advice from a financial professional before making any investment decisions.

Source: https://www.bls.gov/news.release/jolts.nr0.htm


Start futures #forex fx news #trading with Haawks G4A low latency machine-readable data today, one of the fastest news data feeds for US macro-economic and commodity data.

Please let us know your feedback. If you are interested in timestamps, please send us an email to sales@haawks.com.

Comment

Share

Comment

Share

25 pips, US30 90 points and BTC 1018 points potential profit in 40 seconds on 15 January 2025, analysis on futures forex fx low latency news trading USDJPY, EURUSD on US Consumer Price Index (CPI)

According to our analysis USDJPY and EURUSD moved 54 pips, US30 moved 90 points and Bitcoin (BTC) moved 1018 points on US BLS Consumer Price Index (CPI) data on 15 January 2025.

USDJPY (18 pips)

EURUSD (7 pips)

US30 (90 points)

Bitcoin BTC (1018 points)

Charts are exported from JForex (Dukascopy).


December 2024 CPI Report: Core Inflation Falls Short of Expectations – What It Means for Markets

The U.S. Bureau of Labor Statistics released the Consumer Price Index (CPI) for December 2024 on January 15, 2025. While headline inflation was in line with expectations, core inflation (excluding food and energy) came in slightly cooler than anticipated. The headline CPI rose 0.4% month-over-month and 2.9% year-over-year, meeting forecasts. However, core CPI increased by 0.2% month-over-month (vs. 0.3% expected) and 3.2% year-over-year (vs. 3.3% expected). Here’s a breakdown of the report and its implications for traders.

Headline Takeaways

  1. Headline Inflation: The all-items index rose 0.4% month-over-month and 2.9% year-over-year, reflecting steady inflationary pressures in energy and food prices.

  2. Core Inflation Misses: Core CPI rose 0.2% month-over-month, below the forecasted 0.3%. Year-over-year, core inflation moderated to 3.2%, also below the expected 3.3%.

  3. Energy Drives the Headline: Energy prices surged 2.6% month-over-month, with gasoline prices jumping 4.4%, making energy a key driver of the overall CPI increase.

  4. Food Inflation Holds Steady: Food prices rose 0.3% month-over-month, with both food at home and food away from home contributing equally to the increase.

Market Implications of Core CPI Miss

Cooling Core Inflation Trends

  • The 0.2% month-over-month rise in core CPI marked a modest cooling from the expected 0.3%. Year-over-year, the 3.2% core inflation rate signals gradual easing in underlying price pressures.

  • Market Impact: A softer-than-expected core reading could prompt markets to reassess the Federal Reserve’s policy stance, increasing the likelihood of a pause or easing cycle sooner than previously anticipated.

Energy Price Surge Shifts Focus

  • Energy prices rose significantly, with a 4.4% increase in gasoline prices dominating the report. However, on a year-over-year basis, energy remains a deflationary factor, down 0.5%.

  • Market Impact: Energy-driven headline inflation may not alter the Fed’s trajectory if core inflation continues to cool, but it could buoy commodity markets and inflation-sensitive sectors.

Sector Breakdown

Shelter Remains Elevated

  • Shelter costs rose 0.3% month-over-month and 4.6% year-over-year. Shelter remains the largest contributor to core inflation but showed signs of stabilization.

  • Implications for Traders: Persistent shelter inflation could limit the Fed’s flexibility, supporting higher-for-longer interest rate expectations.

Food Prices Steady but Mixed

  • Food at home (+0.3%) and food away from home (+0.3%) rose in tandem. Cereals and bakery products saw a sharp rise (+1.2%), while nonalcoholic beverages (-0.4%) and fruits and vegetables (-0.1%) declined.

  • Market Impact: Stable food inflation supports consumer purchasing power, benefiting consumer discretionary stocks.

Transportation and Autos Drive Core

  • Used cars and trucks rebounded with a 1.2% increase, while new vehicles rose 0.5%. Airline fares surged 3.9%.

  • Implications for Traders: Rising auto and transportation costs could impact consumer sentiment and provide short-term tailwinds to related industries.

Fed Policy Implications

With core CPI coming in below expectations, markets may interpret the data as a sign that inflation is moderating toward the Federal Reserve’s target. While headline inflation remains steady, the softer core reading could shift the Fed’s tone toward a more dovish stance, especially if cooling trends persist.

Trading Opportunities

  1. Equities: Growth stocks and rate-sensitive sectors may gain on expectations of a dovish Fed. Defensive sectors may face headwinds if inflation pressures ease.

  2. Bonds: Treasury yields could decline, particularly on the shorter end of the curve, as markets price in reduced rate hike probabilities.

  3. Commodities: Energy markets may rally due to the sharp increase in gasoline and natural gas prices. Gold could see gains if inflation expectations moderate.

  4. Forex: The U.S. Dollar Index (DXY) might weaken if traders anticipate a softer Fed policy path.

Disclaimer: This blog post is for informational purposes only and should not be construed as financial advice. Always conduct thorough research and consider seeking advice from a financial professional before making any investment decisions.

Source: https://www.bls.gov/news.release/cpi.nr0.htm


Start futures forex fx news trading with Haawks G4A low latency machine-readable data, one of the fastest machine-readable news trading feed for US macro-economic and commodity data.

Please let us know your feedback. If you are interested in timestamps, please send us an email to sales@haawks.com.

Comment

Share

473 pips potential futures forex fx news trading profit from 12 events in the fourth quarter of 2024 with Haawks G4A machine-readable news data feed

Comment

Share

473 pips potential futures forex fx news trading profit from 12 events in the fourth quarter of 2024 with Haawks G4A machine-readable news data feed

We are pleased to announce that there was a potential of 473 pips/ticks profit out of the following 12 events in the fourth quarter of 2024 based on our ex-post analysis. The potential performance for 2024 was 4,305 pips/ticks.

Q4 2024

  • US Macro: 85%
  • US DOE: 15%
  • US Macro: 85%
  • US DOE: 15%
Cumulative potential, indicative performance Q4 2024, please see all releases below.

Total trading time would have been around 8 minutes in 3 months! (preparation time not included)


Quarterly Market Outlook: Navigating Key Economic Events for Traders

As traders, staying ahead of impactful economic events is crucial to identifying opportunities and managing risk effectively. Each quarter, a series of reports and announcements can significantly influence market sentiment and price movements. In this post, we will break down the most notable economic events from October to December 2024 and their implications, helping you prepare your strategy for the months ahead.

October 2024: Key Economic Events

US Employment Situation (Non-Farm Payrolls - NFP)

Date: October 4, 2024
Market Impact: 126 pips

The Non-Farm Payrolls (NFP) report is a critical indicator of the US labor market’s health. In October, this report had a substantial impact of 126 pips, underscoring how deviations from expectations can trigger significant price swings, particularly in USD-related pairs. Traders often see the NFP as a catalyst for both short-term volatility and longer-term trend formation.

Trading Tip: Implement a volatility-based strategy by setting tighter stops and wider profit targets. Be cautious of whipsaw movements and consider using trailing stops.

US Retail Sales, Jobless Claims, and Philadelphia Fed Manufacturing Survey

Date: October 17, 2024
Market Impact: 47 pips

Retail sales reflect consumer spending patterns, making this report an essential measure of economic momentum. Coupled with weekly jobless claims and the Philadelphia Fed’s manufacturing data, this cluster of reports provides a comprehensive snapshot of economic activity.

Trading Tip: Look for correlations between the retail sales trend and currency pairs tied to consumer-driven economies. Divergence between retail sales and jobless claims could present arbitrage opportunities.

US Jobless Claims

Date: October 24, 2024
Market Impact: 24 pips

Weekly jobless claims are often overlooked but can indicate turning points in employment trends. This particular report caused a 24-pip movement, highlighting its capacity to affect sentiment during periods of heightened market sensitivity.

DOE Natural Gas Storage Report

Date: October 24, 2024
Market Impact: 34 ticks

Natural gas traders closely monitor the Department of Energy (DOE) storage report, which provides insights into supply and demand dynamics. In October, this report moved the market by 34 ticks, reflecting energy market volatility.

Trading Tip: Consider layering positions during periods of extreme weather forecasts, which can amplify the impact of the DOE report.

November 2024: Inflation in Focus

US BLS Consumer Price Index (CPI)

Date: November 13, 2024
Market Impact: 54 pips

Inflation data, particularly the CPI, is a key driver of monetary policy expectations. The 54-pip reaction to November’s CPI report demonstrates the market’s sensitivity to inflation surprises.

Trading Tip: Monitor Federal Reserve commentary leading up to the CPI release. A CPI print above expectations can increase the probability of a hawkish Fed response, pushing yields and the dollar higher.

US BLS Producer Price Index (PPI)

Date: November 14, 2024
Market Impact: 31 pips

The PPI, which tracks inflation at the wholesale level, often acts as a leading indicator for consumer inflation. In November, the PPI report moved the markets by 31 pips.

Trading Tip: Keep an eye on sectors with significant input costs, as they may show early signs of pricing pressures that trickle down to CPI readings.

December 2024: Fed Policy and Employment Insights

US BLS Job Openings and Labor Turnover Survey (JOLTS)

Dates: October 29 and December 3, 2024
Market Impact: 15 pips (October) and 18 pips (December)

JOLTS data provides valuable information about labor demand and job openings. While the market impact in pips may seem moderate, JOLTS data plays a key role in shaping expectations for future employment trends.

US Employment Situation (Non-Farm Payrolls - NFP)

Date: December 6, 2024
Market Impact: 37 pips

The December NFP report triggered a 37-pip movement, reflecting sustained interest in employment data as a driver of market sentiment.

Trading Tip: Watch for revisions to previous NFP reports, as they can influence market reactions just as much as the current headline figure.

DOE Natural Gas Storage Report

Date: December 12, 2024
Market Impact: 35 ticks

Another DOE natural gas report in December reinforced the energy market’s sensitivity to storage changes.

FOMC Interest Rate Decision and Projections

Date: December 18, 2024
Market Impact: 36 pips

The Federal Open Market Committee (FOMC) meeting in December is typically a pivotal event as it includes updated economic projections and the interest rate decision. The 36-pip market reaction indicates the influence of policy adjustments and forward guidance on forex markets.

Trading Tip: Prepare for increased volatility during the press conference following the FOMC statement. Focus on any changes to the "dot plot" and projections for future rate hikes or cuts.

Final Thoughts

Understanding the significance of key economic events can empower traders to navigate market volatility with greater confidence. By analyzing historical market reactions and staying attuned to the context of each report, traders can better anticipate potential price movements and tailor their strategies accordingly. Keep your economic calendar updated and remain disciplined in managing risk during these high-impact events. As always, stay informed, stay prepared, and trade wisely.

Disclaimer: This blog post is for informational purposes only and should not be construed as financial advice. Always conduct thorough research and consider seeking advice from a financial professional before making any investment decisions.


Start futures/forex/oil/grains news trading with Haawks G4A low latency machine-readable data today, we offer one of the fastest machine-readable data feeds for US macro-economic and commodity data and macro-economic data from Norway, Sweden, Switzerland Turkey and ECB interest rates and statement.

Please let us know your feedback and check out our G4A low latency data feed.

All data is machine readable and available via API access in Chicago CH1, New York NY2/4 and London LD4. Free trials.

Comment

Share

104 ticks potential profit on 10 January 2025, analysis on trading soybeans, corn and wheat futures on USDA WASDE and USDA Grain Stocks data

Comment

Share

104 ticks potential profit on 10 January 2025, analysis on trading soybeans, corn and wheat futures on USDA WASDE and USDA Grain Stocks data

According to our analysis soybeans (ZS), corn (ZC) and wheat (WC) futures prices moved around 104 ticks (36 ticks, 40 ticks and 28 ticks) on USDA WASDE (World Agricultural Supply and Demand Estimates) and USDA Grain Stocks data on 10 January 2025.

Soybeans (36 ticks)

Charts are exported from JForex (Dukascopy).


January 2025 WASDE and Grain Stocks Report: Key Takeaways for Agricultural Traders

The USDA’s World Agricultural Supply and Demand Estimates (WASDE - 656) and Grain Stocks Report released on January 10, 2025 provide a comprehensive update on the supply, demand, and stock levels for key commodities. For traders, these reports offer essential insights into potential price movements and market dynamics in the months ahead.

Below is a detailed breakdown of the key highlights for cotton, corn, soybeans, and wheat, covering both U.S. and global markets.

1. Cotton: Bearish Signals from Higher Stocks and Lower Prices

  • U.S. Cotton Outlook:

    • Production: Increased by 159,000 bales to 14.4 million bales, driven by higher yields (836 pounds/harvested acre) despite reduced harvested area in the Southwest.

    • Exports: Lowered by 300,000 bales to 11.0 million bales.

    • Ending Stocks: Increased to 4.8 million bales, pushing the stocks-to-use ratio to 38%.

    • Farm Price: Reduced to 65 cents per pound, reflecting ample supply and reduced export demand.

  • Global Cotton Market:

    • Production: Raised by 2 million bales to 119.4 million bales, primarily due to a 1.8 million-bale increase in China.

    • Consumption: Increased by 100,000 bales, driven by Bangladesh and Vietnam.

    • Trade: Global exports are up 225,000 bales, as gains in Brazil, Australia, and India offset the reduction in U.S. exports.

    • Ending Stocks: Increased by 1.9 million bales, with notable increases in China, Australia, and India.

💡 Trading Takeaway:
The cotton market presents bearish signals as higher global production and U.S. export cuts weigh on prices. Traders should monitor Southeast Asian demand closely and assess the potential impact of China’s stockpiling strategy.

2. Corn: Tighter Supplies Signal Price Support

U.S. Corn Outlook (WASDE):

  • Production: Cut to 14.9 billion bushels (-276 million bushels), reflecting a yield reduction to 179.3 bushels/acre (-3.8 bushels/acre).

  • Use:

    • Feed & Residual: Reduced by 50 million bushels to 5.8 billion bushels, due to lower-than-expected feed demand.

    • Exports: Lowered by 25 million bushels to 2.5 billion bushels.

  • Ending Stocks: Reduced by 198 million bushels to 1.88 billion bushels.

  • Farm Price: Increased to $4.25 per bushel (+$0.15), reflecting tighter supplies.

Grain Stocks Report (Corn):

  • Total Corn Stocks (Dec 1, 2024): 12.1 billion bushels (-1% year-over-year).

    • On-Farm Stocks: 7.66 billion bushels (-2%).

    • Off-Farm Stocks: 4.41 billion bushels (+2%).

  • Disappearance (Sep-Nov 2024): 4.56 billion bushels, slightly above the 4.53 billion bushels reported for the same period in 2023.

Global Corn Market:

  • Production: Lowered by 4.8 million tons to 1.494 billion tons, though China’s record harvest (294.9 million tons) offsets some global losses.

  • Trade: Global exports declined due to reductions in U.S. and Brazilian shipments.

  • Ending Stocks: Lowered by 3.1 million tons to 293.3 million tons, with China increasing its reserves to a record level.

💡 Trading Takeaway:
Corn prices could remain firm due to tightening U.S. supplies and strong domestic feed demand. The market will closely watch Brazil’s export pace and China’s reserve strategy as key determinants of price direction.

3. Soybeans: Higher Stocks with Strong Seasonal Demand

Grain Stocks Report (Soybeans):

  • Total Soybean Stocks (Dec 1, 2024): 3.10 billion bushels (+3% year-over-year).

    • On-Farm Stocks: 1.54 billion bushels (+6%).

    • Off-Farm Stocks: 1.56 billion bushels (+1%).

  • Disappearance (Sep-Nov 2024): 1.61 billion bushels, up 13% from the same period in 2023, reflecting stronger seasonal demand.

U.S. Soybean Outlook (WASDE):

While soybeans were not specifically highlighted in the WASDE production changes, the robust disappearance from the Grain Stocks Report signals sustained demand, especially for exports and domestic processing.

💡 Trading Takeaway:
The combination of rising stocks and strong disappearance could lead to price fluctuations. Traders should closely watch South American harvest updates and any geopolitical developments that could influence export markets.

4. Wheat: Rising Stocks Amid Strong Demand

U.S. Wheat Outlook (WASDE):

  • Supplies: Increased by 5 million bushels to 130 million bushels, driven by higher imports of Hard Red Spring wheat.

  • Domestic Use:

    • Feed & Residual Use: Unchanged at 120 million bushels.

    • Seed Use: Increased by 2 million bushels to 64 million bushels.

  • Exports: Steady at 850 million bushels despite by-class adjustments.

  • Ending Stocks: Raised by 3 million bushels to 798 million bushels (+15% year-over-year).

  • Farm Price: Reduced by $0.05 to $5.55 per bushel.

Grain Stocks Report (Wheat):

  • Total Wheat Stocks (Dec 1, 2024): 1.57 billion bushels (+10% year-over-year).

    • On-Farm Stocks: 467 million bushels (+16%).

    • Off-Farm Stocks: 1.10 billion bushels (+8%).

  • Disappearance (Sep-Nov 2024): 423 million bushels, up 22% from the same period in 2023, reflecting robust demand.

Global Wheat Market:

  • Supplies: Raised by 0.4 million tons to 1,060.7 million tons, with gains in Syria and Pakistan offsetting reductions in Uruguay.

  • Consumption: Lowered by 0.6 million tons, with Turkey’s demand decrease partially offset by increased usage in Ukraine.

  • Trade: Global exports are down 1.7 million tons due to reduced shipments from Russia and Ukraine.

  • Ending Stocks: Increased by 0.9 million tons to 258.8 million tons, with increases in Russia, Brazil, and Ukraine offsetting declines in China and Indonesia.

💡 Trading Takeaway:
The wheat market remains mixed. While U.S. imports and global stocks are rising, strong domestic demand and geopolitical tensions in the Black Sea region could continue to influence prices. Traders should watch for export developments and changes in demand from key buyers like Turkey and China.

Key Summary for Traders:

Commodity     U.S. Supply Trend     Global Supply Trend     Market Sentiment    
Cotton Higher stocks Rising global production Bearish
Corn Lower production Slight stock decline Bullish
Soybeans Higher stocks Strong demand Mixed
Wheat Increased imports Higher global stocks Mixed

Final Thoughts:

Agricultural markets are bracing for potential price volatility as the WASDE and Grain Stocks reports highlight key supply and demand shifts. Key areas to watch include:

  1. Cotton: Price pressure remains due to higher global production and reduced U.S. exports.

  2. Corn: Tighter U.S. supplies and robust feed demand could support prices.

  3. Soybeans: Despite higher stocks, strong seasonal demand may limit bearish movements.

  4. Wheat: Strong demand contrasts with rising stocks, creating a mixed outlook sensitive to geopolitical risks.

Traders should remain alert to any new developments, particularly weather conditions in South America, policy changes in China, and ongoing geopolitical tensions, as these could significantly impact commodity prices in the coming months.

Disclaimer: This blog post is for informational purposes only and should not be construed as financial advice. Always conduct thorough research and consider seeking advice from a financial professional before making any investment decisions.

Source: https://www.usda.gov/oce/commodity/wasde/wasde0125.pdf, https://downloads.usda.library.cornell.edu/usda-esmis/files/xg94hp534/5d86qt759/xp68nc84m/grst0125.pdf


Haawks G4A is one of the fastest machine-readable data feeds for USDA data. We are beating big names in the industry by seconds. Coverage includes monthly USDA WASDE (World Agricultural Supply and Demand Estimates), quarterly USDA Grain Stocks and yearly USDA Prospective Plantings and USDA Acreage.

Please let us know your feedback. If you are interested in timestamps, please send us an email to sales@haawks.com.

Comment

Share

Comment

Share

35 pips and 210 points potential profit in 80 seconds on 10 January 2025, analysis on forex fx futures news trading USDJPY, EURUSD and US30 on US Employment Situation (Non-farm payrolls/NFP) data

According to our analysis USDJPY, EURUSD and US30 moved around 35 pips and 210 points on US Employment Situation (Non-farm payrolls / NFP) data on 10 January 2025.

USDJPY (19 pips)

EURUSD (16 pips)

US30 (210 points)

Charts are exported from JForex (Dukascopy).


December 2024 Employment Report: Key Takeaways for Traders

The U.S. Bureau of Labor Statistics (BLS) released its December 2024 Employment Situation Report today, revealing a mixed but largely positive labor market. Here’s what traders need to know and how the data could influence markets in the near term.

Key Highlights of the Report

  • Nonfarm Payroll Growth:
    Nonfarm payrolls increased by 256,000, beating market expectations. Gains were led by health care, government, social assistance, and retail trade.

  • Unemployment Rate:
    The unemployment rate held steady at 4.1%, indicating a resilient labor market despite concerns of potential softening.

  • Wage Growth:
    Average hourly earnings increased by 0.3% month-over-month (+10 cents), bringing the annual wage growth to 3.9% year-over-year.

  • Labor Force Participation Rate:
    Unchanged at 62.5%, maintaining the same range seen throughout 2024.

Market Implications

1. Equity Markets:

  • Bullish Signal: The robust payroll growth could support cyclical sectors like retail, health care, and consumer discretionary.

  • Earnings Potential: With strong wage gains and improved retail hiring, markets may see positive sentiment heading into Q1 earnings season.

  • Caveat: If wage growth accelerates beyond expectations in future reports, it could reignite inflation fears.

2. Bond Markets:

  • The steady unemployment rate and solid job gains could increase the likelihood of the Federal Reserve holding interest rates steady. However, continued strength may push yields higher if investors price in a more hawkish Fed stance.

3. Forex Market:

  • The U.S. dollar may strengthen in response to better-than-expected job numbers, as it reinforces confidence in the U.S. economy.

  • Watch for USD pairs, particularly with currencies of economies that are experiencing slower labor market recoveries.

Sector Breakdown for December 2024

  • Health Care (+46,000 jobs): Gains were seen across home health care services (+15,000), nursing care facilities (+14,000), and hospitals (+12,000). This continued sector strength may benefit health care ETFs and equities.

  • Retail Trade (+43,000 jobs): A recovery from November’s losses was driven by increases in apparel, general merchandise, and health and personal care stores. Retail-focused traders may view this as a sign of resilient consumer demand.

  • Government (+33,000 jobs): Job gains, primarily in state government roles, continued a positive trend, though at a slower pace than in 2023.

  • Social Assistance (+23,000 jobs): Continued steady growth here supports the broader theme of demand for care services.

Wage and Workweek Trends

  • Average Hourly Earnings: Up $0.10 to $35.69 (+3.9% YoY).

  • Production and Nonsupervisory Workers: Wages increased by $0.06 to $30.62, signaling continued earnings momentum for middle-income workers.

However, the average workweek remained at 34.3 hours, unchanged for the fifth consecutive month, indicating stable labor utilization across sectors.

Revisions and Seasonal Adjustments

The revisions for October and November combined resulted in a net downward adjustment of 8,000 jobs. Traders should take note of these recalibrations, which may indicate some volatility in reporting but largely point to a stable employment trend.

Key Risks to Watch

  • Fed Policy: Traders should monitor any commentary from Federal Reserve officials, as this report keeps the door open for either policy stability or future tightening if wage pressures persist.

  • Economic Slowdown Concerns: While the labor market remains strong, longer-term concerns about a potential slowdown in consumer spending or corporate hiring could affect future payroll reports.

  • Global Market Sentiment: The forex and commodity markets could be impacted by how global investors interpret the U.S. labor market’s strength relative to international economic conditions.

Conclusion

The December 2024 employment report reinforces the narrative of a robust U.S. labor market with healthy job creation, stable unemployment, and moderate wage growth. Traders should position themselves for potential equity market gains in cyclical sectors while keeping a close eye on bond yields and the Federal Reserve's evolving stance. The next employment report, scheduled for February 7, 2025, will provide further clues as to whether this momentum can continue into the new year.

Source: https://www.bls.gov/news.release/empsit.nr0.htm


Start forex fx futures news trading with Haawks G4A low latency machine-readable data today, one of the fastest news data feeds for US macro-economic and commodity data.

Please let us know your feedback. If you are interested in timestamps, please send us an email to sales@haawks.com.

Comment

Share

Comment

Share

25 pips potential profit in 153 seconds on 7 January 2025, analysis on futures forex fx news trading EURUSD and USDJPY on US BLS Job Openings and Labor Turnover Survey (JOLT) data

According to our analysis USDJPY and EURUSD moved 25 pips on US BLS Job Openings and Labor Turnover Survey (JOLT) data on 7 January 2025.

USDJPY (13 pips)

EURUSD (12 pips)

Charts are exported from JForex (Dukascopy).


Understanding the Job Market: Insights from the November 2024 JOLTS Report

The U.S. Bureau of Labor Statistics (BLS) recently released its Job Openings and Labor Turnover Survey (JOLTS) report for November 2024, shedding light on the current state of the labor market. Let’s break down the key takeaways and what they mean for job seekers, employers, and policymakers.

Overview of the Labor Market

In November 2024, the number of job openings remained steady at 8.1 million, reflecting minimal month-over-month change but indicating a year-over-year decrease of 833,000 openings. Despite this overall stability, there were notable fluctuations within specific industries that underscore the nuanced nature of the current labor market.

Job Openings: Industry Trends

The job openings rate, at 4.8%, remained largely unchanged. However, there were significant shifts within certain sectors:

  • Professional and Business Services: Increased by +273,000 job openings.

  • Finance and Insurance: Gained +105,000 new openings.

  • Private Educational Services: Increased by +38,000.

  • Information Sector: Decreased by -89,000 openings.

These trends suggest continued demand for professionals in service-oriented roles and financial sectors, while industries such as information technology face a reduction in new opportunities.

Hiring Activity

The number of hires in November 2024 stood at 5.3 million, reflecting no significant month-to-month change but marking a year-over-year decline of 300,000 hires. The overall hiring rate remained at 3.3%, signaling a labor market where hiring activity is maintaining a slower but steady pace.

Separations and Quits: A Closer Look

Total separations, which include quits, layoffs, and other types of departures, were 5.1 million in November, down 287,000 from the same period last year. Here’s how the components break down:

  • Quits: The number of voluntary resignations dropped to 3.1 million, a decrease of 218,000 over the month and 451,000 over the year. This brought the quits rate to 1.9%, signaling more caution among workers when considering job changes.

  • Layoffs and Discharges: These involuntary separations remained at 1.8 million, although this figure represents an increase of 219,000 compared to the previous year. This uptick was particularly noticeable in the accommodation and food services sector, which saw +102,000 additional layoffs and discharges.

The drop in quits suggests a more conservative approach from workers in a period of economic uncertainty, while the rise in layoffs points to possible cost-cutting measures in certain industries.

Impact by Establishment Size

The report also highlighted differences based on company size:

  • Small Establishments (1-9 employees): Experienced a decrease in layoffs and discharges.

  • Large Establishments (5,000+ employees): Showed little to no change in job openings, hires, or separations, indicating stability in employment patterns for larger employers.

Revisions for October 2024

Revisions to the previous month’s data provided additional clarity:

  • Job Openings: Revised upward by 95,000 to 7.8 million.

  • Hires: Revised upward by 81,000 to 5.4 million.

  • Separations: Revised upward by 45,000 to 5.3 million.

  • Within separations, quits were revised downward by 43,000 to 3.3 million, while layoffs and discharges were revised upward by 115,000.

These revisions underscore the importance of ongoing data collection and adjustments as more information becomes available.

What This Means for You

For Job Seekers: The reduction in voluntary quits suggests that fewer people are willing to take the risk of switching jobs. However, opportunities in professional services, finance, and education remain strong.

For Employers: Businesses in certain sectors may need to reconsider hiring and retention strategies to compete for available talent, especially as hiring has slowed but layoffs remain elevated in some industries.

For Policymakers: The increase in layoffs in specific industries and the overall cooling in quits could indicate emerging economic pressures, potentially influencing future policy decisions related to labor and employment.

Looking Ahead

The next JOLTS report, covering December 2024, is scheduled for release on February 4, 2025. As we head into the new year, it will be critical to monitor how labor trends evolve amid changing economic conditions.

Understanding these data points provides valuable context for navigating the complexities of the labor market. Whether you are planning your next career move or assessing your business’s hiring strategies, staying informed is key to making proactive decisions.

Source: https://www.bls.gov/news.release/jolts.nr0.htm


Start futures #forex fx news #trading with Haawks G4A low latency machine-readable data today, one of the fastest news data feeds for US macro-economic and commodity data.

Please let us know your feedback. If you are interested in timestamps, please send us an email to sales@haawks.com.

Comment

Share

Comment

Share

28 pips potential profit in 222 seconds on 2 January 2025, analysis on futures forex fx news trading USDJPY and EURUSD on US Jobless Claims data

According to our analysis USDJPY and EURUSD moved 28 pips on US Jobless Claims data on 2 January 2025.

USDJPY (28 pips)

Charts are exported from JForex (Dukascopy).


Weekly Unemployment Insurance Claims: Key Takeaways from the Latest Report

The latest release from the U.S. Department of Labor on unemployment insurance claims, which was embargoed until 8:30 a.m. (Eastern) on January 2, 2025, sheds light on the current labor market conditions as the year begins. The data provides an overview of initial and continued claims, reflecting overall economic trends and providing an indicator of job market stability.

Initial Claims: A Positive Trend

For the week ending December 28, the seasonally adjusted initial claims for unemployment insurance dropped to 211,000, marking a decrease of 9,000 from the previous week’s revised figure of 220,000. This decline in initial claims indicates a promising trend for job seekers and signals a reduction in layoffs and firings.

It is worth noting that the previous week’s claims were adjusted upward by 1,000 from the originally reported 219,000. Despite this revision, the overall decrease in new claims suggests resilience in the labor market.

4-Week Moving Average: Stability in the Trend

The 4-week moving average, a more stable indicator that smooths out weekly volatility, decreased by 3,500 to 223,250. This figure is down from the revised average of 226,750 from the previous week. The modest but steady downward trend in the moving average indicates that the labor market has maintained relative stability over the past month.

Insured Unemployment Rate: Slight Decline

The advance seasonally adjusted insured unemployment rate for the week ending December 21 fell by 0.1 percentage point to 1.2%. This insured unemployment rate measures the proportion of the labor force currently receiving unemployment benefits and is a key indicator of sustained employment levels.

Continued Claims: Encouraging Decrease

The advance number of seasonally adjusted insured unemployment claims—often referred to as "continued claims"—for the week ending December 21 was 1,844,000, reflecting a decrease of 52,000 from the revised figure of 1,896,000 for the previous week. This decrease in continued claims is another positive sign of improving employment prospects.

The previous week’s continued claims were revised downward by 14,000 from 1,910,000 to 1,896,000. Such downward revisions can reflect better-than-expected retention in the workforce and highlight corrections based on updated data.

4-Week Moving Average of Continued Claims

Similarly, the 4-week moving average of continued claims decreased by 6,750 to 1,870,750. This represents a slight improvement from the revised average of 1,877,500 from the previous week. The consistent downward trend over recent weeks further underscores the broader labor market’s ability to absorb job losses and maintain employment growth.

What This Means for the Economy

The latest data on unemployment claims indicates that the job market remains strong despite economic uncertainties. Declining initial and continued claims suggest that layoffs are minimal and that workers who lose their jobs are able to find new employment relatively quickly.

This trend aligns with broader economic indicators that suggest continued growth in the labor market as 2025 begins. While external factors such as inflation and global economic conditions may pose risks, the sustained decrease in unemployment claims points to a healthy job market that supports economic resilience.

Looking Ahead

As the economy moves into the new year, economists and policymakers will closely monitor labor market data to gauge the effects of monetary policies and broader economic shifts. For job seekers, these figures provide a hopeful outlook, indicating that employment opportunities remain abundant.

The next report on unemployment claims will provide further insight into whether this trend continues or shifts. For now, the data shows a labor market that continues to stabilize and strengthen after a year of navigating economic uncertainties.

Stay tuned for future updates as we track key employment trends and what they mean for the broader economy.

Sources: https://www.dol.gov/ui/data.pdf


Please let us know your feedback. If you are interested in timestamps, please send us an email to sales@haawks.com.

Start futures forex fx news trading with Haawks G4A low latency machine-readable data today, one of the fastest news data feeds for US macro-economic and commodity data.

Comment

Share

126 pips potential forex fx futures news trading profit from 4 events in December 2024 with Haawks G4A machine-readable data feed

Comment

Share

126 pips potential forex fx futures news trading profit from 4 events in December 2024 with Haawks G4A machine-readable data feed

According to our analysis there was a potential of 126 pips / ticks profit out of the following 4 events in December 2024. The potential performance in 2024 was 4,305 pips / ticks.

December 2024

  • US Macro: 72%
  • US DOE: 28%
  • US Macro: 72%
  • US DOE: 28%
Cumulative potential, indicative performance December 2024, please see all releases below.

Total trading time would have been around 3 minutes! (preparation time not included)


Navigating Key Economic Releases: December 2024 Insights

December 2024 presents a series of pivotal economic releases that promise to shape the financial markets’ trajectory as we close the year. With markets bracing for volatility, understanding the nuances of these data points is essential for traders and analysts alike. Below, we dissect the key releases: the JOLT survey, Non-Farm Payrolls (NFP), DOE Natural Gas Storage Report, and the FOMC interest rate decision.

1. US BLS Job Openings and Labor Turnover Survey (JOLT)

Release Date: December 3, 2024
Historical Impact: ~18 pips on forex markets

The JOLT survey is a cornerstone in gauging labor market health. In December 2024, market participants will scrutinize job openings, hires, and quits rates. These metrics provide insights into labor demand and employee confidence. High job openings suggest robust demand, whereas elevated quits typically indicate worker confidence in securing alternative employment.

Research Highlights:

  • Comparative Trends: With the Fed closely monitoring labor tightness to combat inflation, the JOLT data could hint at wage pressures.

  • Sectoral Shifts: Watch for growth in tech, healthcare, and leisure industries, which historically exhibit sensitivity to broader economic conditions.

2. US Employment Situation (Non-Farm Payrolls / NFP)

Release Date: December 6, 2024
Historical Impact: ~37 pips on forex markets

The NFP report remains the month’s most anticipated release. Beyond the headline payroll number, traders should evaluate unemployment rates and average hourly earnings. These components often guide monetary policy expectations.

Key Considerations:

  • Wage Growth: Accelerating wages could validate concerns of sticky inflation, prompting hawkish Federal Reserve action.

  • Sectoral Employment: Look for potential divergences, such as strength in construction and logistics versus weaknesses in retail.

3. DOE Natural Gas Storage Report

Release Date: December 12, 2024
Historical Impact: ~35 ticks on natural gas futures

Seasonal patterns often amplify the significance of the DOE’s natural gas storage report in December. As winter demand peaks, inventory data offers critical supply-demand balance insights.

Market Dynamics:

  • Weather Correlations: Cold weather forecasts could exacerbate price volatility if storage draws exceed expectations.

  • Production Trends: Monitor domestic production levels and LNG exports, which have increasingly influenced global natural gas prices.

4. FOMC Interest Rate Decision and Projections

Release Date: December 18, 2024
Historical Impact: ~36 pips on forex markets

The Federal Reserve’s December meeting will be particularly consequential, as it includes updated economic projections. The interest rate decision and accompanying Summary of Economic Projections (SEP) will clarify the Fed’s policy direction.

Focus Areas:

  • Interest Rate Path: Markets will parse the dot plot to infer future rate trajectories.

  • Inflation and Growth Forecasts: Revisions to core PCE inflation and GDP growth forecasts will influence broader sentiment.

  • Press Conference Signals: Chair Powell’s commentary could provide vital clues on how the Fed views labor market resilience and inflation trends heading into 2025.

Strategies for Traders

  • Pre-Positioning: Historically, markets exhibit caution ahead of these releases. Consider reducing exposure to avoid whipsaws.

  • Event-Specific Plays:

    • JOLT and NFP: Focus on USD pairs and bond yields.

    • Natural Gas Storage Report: Trade volatility in natural gas futures and ETFs.

    • FOMC Decision: Watch for broad USD moves and sectoral impacts on equities.

  • Cross-Market Analysis: Evaluate correlations between equities, commodities, and forex to anticipate broader market reactions.

Conclusion

December 2024 offers a dense calendar of influential economic data. By closely monitoring these releases and contextualizing them within broader macroeconomic trends, traders and analysts can better navigate the complexities of the financial markets. Staying informed and agile will be key as the year concludes with these impactful events.

Disclaimer: This blog post is for informational purposes only and should not be construed as financial advice. Always conduct thorough research and consider seeking advice from a financial professional before making any investment decisions.


Start futures/forex/oil/grains news trading with Haawks G4A low latency machine-readable data today, we offer one of the fastest machine-readable data feeds for US macro-economic and commodity data and macro-economic data from Norway, Sweden, Turkey, Switzerland and ECB interest rates and statement.

Please let us know your feedback and check out our G4A low latency data feed.

All data is machine readable and available via API access in Aurora, CH1, NY4 and LD4. Free trials.

Comment

Share

Comment

Share

36 pips potential profit in 144 seconds on 18 December 2024, analysis on futures forex fx low latency news trading USDJPY and EURUSD on FOMC Interest Rate Decision data

According to our analysis USDJPY and EURUSD moved 36 pips on FOMC Interest Rate Decision and Projections data on 18 December 2024.

USDJPY (13 pips)

EURUSD (23 pips)

Charts are exported from JForex (Dukascopy).


Federal Reserve Cuts Interest Rates and Releases Updated Economic Projections for 2024-2027

Date: December 18, 2024

The Federal Reserve has made headlines today by not only cutting the federal funds rate by 0.25 percentage points to a target range of 4.25% to 4.5% but also releasing its latest Summary of Economic Projections (SEP). These projections outline the Federal Open Market Committee’s (FOMC) expectations for key economic indicators, including GDP growth, unemployment, and inflation, through 2027.

Key Economic Projections for 2024-2027

The SEP provides a detailed look at the anticipated trajectory of the U.S. economy, offering insight into where the Fed believes things are headed under current policy assumptions. Here’s a breakdown of the highlights:

1. Real GDP Growth

  • 2024: Projected to grow by 2.5% (up from 2.0% in the September projection).

  • 2025: Growth slows slightly to 2.1%.

  • 2026: Expected at 2.0%.

  • 2027: Further tapering to 1.9%.

  • Longer Run: A sustainable growth rate of 1.8%.

Context: The upward revision in 2024’s GDP projection reflects confidence in the economy’s resilience, despite higher interest rates throughout the year. Growth is anticipated to gradually moderate over the longer term.

2. Unemployment Rate

  • 2024: Median projection of 4.2%.

  • 2025-2027: Steady at 4.3%.

  • Longer Run: Expected to stabilize at 4.2%.

Context: While the labor market is expected to ease slightly, unemployment projections remain historically low, indicating a relatively healthy job market.

3. PCE Inflation (Personal Consumption Expenditures)

  • 2024: Projected at 2.4%.

  • 2025: Slight increase to 2.5%.

  • 2026: Moderates to 2.1%.

  • 2027: Aligns with the Fed’s target at 2.0%.

  • Longer Run: Stable at 2.0%.

Context: Inflation remains a key concern, but projections suggest the Fed expects to achieve its 2% goal by 2027.

4. Core PCE Inflation (Excluding Food and Energy)

  • 2024: 2.8%.

  • 2025: Drops to 2.5%.

  • 2026: Further down to 2.2%.

  • 2027: Aligns with the target at 2.0%.

Context: Core inflation, which excludes volatile food and energy prices, is projected to remain slightly elevated in the near term before converging with the overall inflation target.

5. Federal Funds Rate

  • 2024: Projected to end at 4.4%.

  • 2025: Declines to 3.9%.

  • 2026: Further reduces to 3.4%.

  • 2027: Expected to stabilize at 3.1%.

  • Longer Run: Settles at 3.0%.

Context: The Fed’s policy path suggests a gradual easing of interest rates over the next few years, reflecting confidence that inflation will continue to cool while supporting economic growth.

What Does This Mean for the Economy?

1. Growth with Stability

The upward revision of 2024 GDP growth indicates the economy is performing better than previously expected. While growth is expected to moderate, it’s not anticipated to stall, suggesting a soft landing rather than a recession.

2. Labor Market Resilience

The projected unemployment rate remains low, indicating that even as the economy adjusts to higher interest rates, the job market is expected to remain resilient. This provides reassurance for workers and consumers.

3. Inflation Under Control

The Fed’s inflation projections suggest confidence that price pressures will continue to ease. Achieving the 2% inflation target by 2027 will be a key milestone for restoring economic stability.

4. Gradual Rate Cuts

With the federal funds rate projected to decline gradually over the next few years, borrowing costs for consumers and businesses are likely to decrease. This could support investments in housing, business expansion, and consumer spending.

Market Reactions and Future Policy

Despite the Fed’s rate cut and optimistic projections, the stock market declined following the announcement. Investors appear to remain wary of lingering uncertainties surrounding the economy, inflation, and future policy adjustments. The market’s reaction underscores concerns about potential risks to growth and the Fed’s ability to navigate these challenges effectively.

Conclusion: A Measured Approach to Monetary Policy

The Fed’s decision to cut rates and its detailed economic projections signal a measured approach to navigating economic uncertainty. The central bank remains committed to fostering maximum employment and price stability while adapting to changing conditions.

As we move into 2025, all eyes will be on inflation trends, labor market conditions, and the Fed’s ongoing policy decisions. For now, today’s actions provide cautious optimism that the U.S. economy can continue to grow while keeping inflation under control, though market sentiment remains cautious.

Source: https://www.federalreserve.gov/newsevents/pressreleases/monetary20241218a.htm, https://www.federalreserve.gov/monetarypolicy/fomcprojtabl20241218.htm


Start futures forex fx news trading with Haawks G4A low latency machine-readable data, one of the fastest machine-readable news trading feeds for US macro-economic and commodity data.

Please let us know your feedback. If you are interested in timestamps, please send us an email to sales@haawks.com.

Comment

Share

Comment

Share

35 ticks potential profit in 16 seconds on 12 December 2024, analysis on futures forex fx news trading natural gas on DOE Natural Gas Storage Report data

According to our analysis natural gas moved 35 ticks on DOE Natural Gas Storage Report data on 12 December 2024.

Natural gas (35 ticks)

Charts are exported from JForex (Dukascopy).


Weekly Natural Gas Storage Report Analysis for December 6, 2024

Released: December 12, 2024
Next Release: December 19, 2024

The Energy Information Administration (EIA) has released its latest Weekly Natural Gas Storage Report for the week ending December 6, 2024. This report provides valuable insights into natural gas inventories across the United States, helping analysts, traders, and policymakers understand supply and demand dynamics during the winter season.

Key Highlights

  • Total Working Gas in Storage: 3,747 billion cubic feet (Bcf)

  • Net Decrease: 190 Bcf from the previous week’s total of 3,937 Bcf

  • Year-Over-Year Comparison: 67 Bcf higher than the same period last year

  • Five-Year Average Comparison: 165 Bcf above the five-year average of 3,582 Bcf

At 3,747 Bcf, the current storage levels remain within the five-year historical range, indicating a relatively balanced inventory despite a notable weekly draw.

Summary of Regional Trends

  • East Region: The East saw a significant withdrawal of 58 Bcf, bringing current stocks to 856 Bcf. Compared to last year and the five-year average, this is a modest decrease of 0.7% and 0.3%, respectively.

  • Midwest Region: The Midwest experienced a 60 Bcf drawdown, reducing storage to 1,055 Bcf. Inventories are 0.8% lower than last year but still 1.9% above the five-year average.

  • Mountain Region: Despite a relatively small withdrawal of 7 Bcf, the Mountain region’s storage levels remain robust at 282 Bcf. This represents a 15.6% increase over last year and a 33% increase over the five-year average.

  • Pacific Region: The Pacific region saw an 8 Bcf draw, ending the week at 302 Bcf. Stocks are 4.5% higher than a year ago and 11.9% above the five-year average.

  • South Central Region: This region had the largest total withdrawal of 59 Bcf, bringing the total to 1,251 Bcf. Salt facilities contributed a 22 Bcf decline, while nonsalt facilities saw a 37 Bcf reduction. Despite the draw, stocks remain 2.4% higher than last year and 3.6% above the five-year average.

Key Insights and Market Implications

  1. Seasonal Draws Begin to Ramp Up: With winter demand in full swing, withdrawals are accelerating. The total net decrease of 190 Bcf underscores the increased consumption driven by colder weather.

  2. Healthy Inventories: Despite significant weekly draws, storage levels are still above both last year’s figures and the five-year average. This suggests a cushion against potential supply disruptions during peak winter demand.

  3. Regional Variations: The Mountain and Pacific regions continue to show robust storage levels compared to historical averages, while the East and Midwest are experiencing tighter supplies.

  4. Potential Market Impact: These storage dynamics can influence natural gas prices. Continued draws at this pace may push prices higher, particularly if cold weather persists.

Looking Ahead

The next report, scheduled for December 19, 2024, will provide further insights into how winter demand is impacting natural gas inventories. As we move deeper into the season, monitoring these weekly changes will be critical for assessing market stability and price trends.

Stay tuned for more updates and analysis!

Source: https://ir.eia.gov/ngs/ngs.html


Start futures forex fx commodity news trading with Haawks G4A low latency machine-readable data, one of the fastest data feeds for DOE data.

Please let us know your feedback. If you are interested in timestamps, please send us an email to sales@haawks.com.

Comment

Share