Blog — HAAWKS

Viewing entries tagged
US

Comment

Share

40 ticks potential profit in 26 seconds on 25 July 2024, analysis on futures forex fx news trading natural gas on DOE Natural Gas Storage Report data

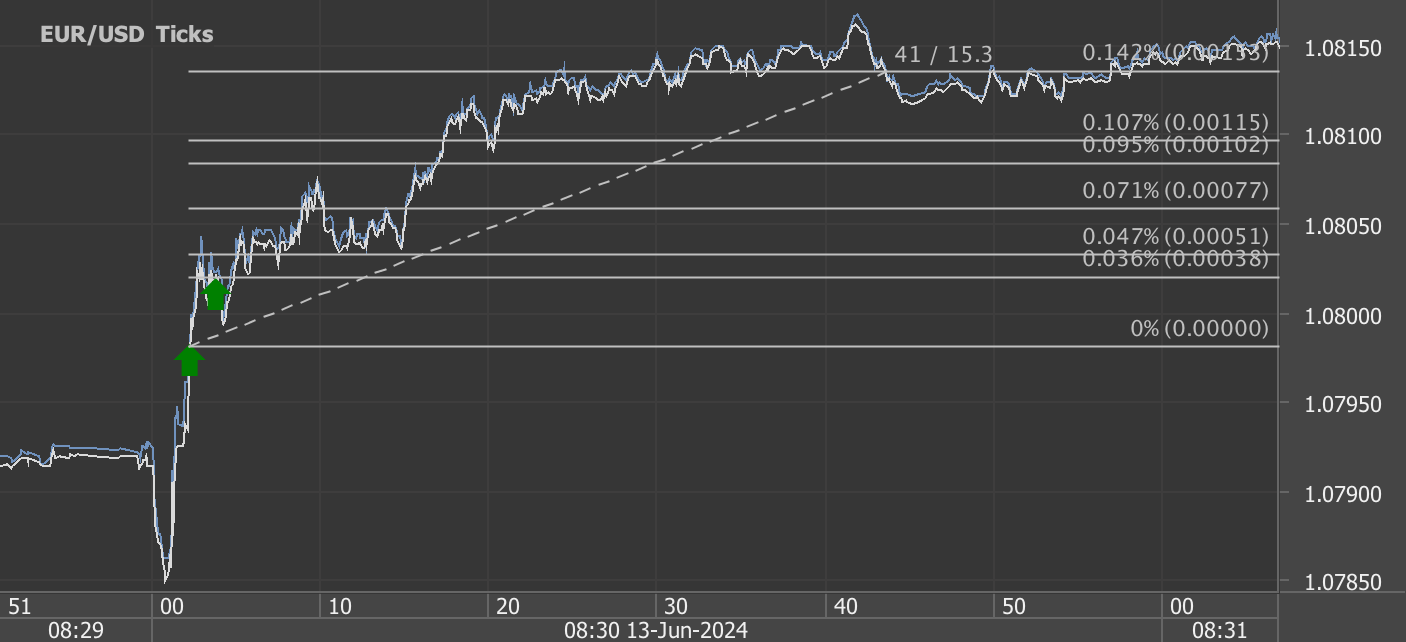
According to our analysis natural gas moved 40 ticks on DOE Natural Gas Storage Report data on 25 July 2024.

Natural gas (40 ticks)

Charts are exported from JForex (Dukascopy).


Understanding the Latest Trends in Natural Gas Storage

In the most recent Weekly Natural Gas Storage Report released on July 25, 2024, covering data up to the week ending July 19, 2024, we observe a detailed overview of the natural gas inventories across the United States. The Energy Information Administration (EIA) provides a comprehensive breakdown that not only informs stakeholders but also hints at broader economic implications.

Key Findings from the Report

  • Total Working Gas Increase: The total working gas in the underground storage was reported at 3,231 billion cubic feet (Bcf), marking an increase of 22 Bcf from the previous week. This suggests a slightly higher than expected accumulation, considering the week-on-week data.

  • Yearly and Historical Comparisons: When compared to the same period last year, current stocks are higher by 249 Bcf. Moreover, when measured against the five-year average from 2019 to 2023, stocks are up by 456 Bcf. These figures indicate a robust stockpiling activity that outpaces both last year’s figures and the longer-term average.

  • Regional Breakdown:

    • East: The East showed an increase to 697 Bcf, up from 686 Bcf the previous week.

    • Midwest: Stocks rose to 827 Bcf from 814 Bcf, showcasing a substantial net change.

    • Mountain: This region’s stocks saw a smaller increase, rising modestly from 248 Bcf to 251 Bcf.

    • Pacific: Remained steady at 289 Bcf, indicating stability in this region’s gas storage.

    • South Central: Interestingly, this region reported a slight decrease, down 6 Bcf from the previous week.

  • Coefficient of Variation and Standard Error: The coefficient of variation, an indicator of the variability relative to the mean of the dataset, remains low across the board, suggesting that the storage volumes are not prone to large swings, thus providing some stability in supply expectations.

Implications for Markets and Policy

The above-average stock levels relative to both last year and the five-year average can have several implications:

  • Market Impact: Higher storage levels typically moderate natural gas prices due to increased supply security. This could influence everything from residential heating costs to the operational costs for industries reliant on natural gas.

  • Policy Considerations: With an ongoing robust supply, policy makers might look at opportunities to adjust export levels or reconsider strategies for sustainable energy utilization.

Conclusion

As we head towards the latter part of 2024, the natural gas storage levels are demonstrating a significant cushion compared to historical levels. This robustness in natural gas storage not only helps in stabilizing prices but also plays a critical role in energy security during peak demand periods like winter. Going forward, stakeholders will be keenly watching the trends to gauge the potential economic and environmental impacts of these stock levels.

For more detailed insights and implications, stakeholders are encouraged to stay tuned for the next release on August 1, 2024, which will further shape the understanding of natural gas trends and strategic responses.

Source: https://ir.eia.gov/ngs/ngs.html


Start futures forex fx commodity news trading with Haawks G4A low latency machine-readable data, one of the fastest data feeds for DOE data.

Please let us know your feedback. If you are interested in timestamps, please send us an email to sales@haawks.com.

Comment

Share

Comment

Share

32 ticks potential profit in 58 seconds on 18 July 2024, analysis on futures forex fx news trading natural gas on DOE Natural Gas Storage Report data

According to our analysis natural gas moved 32 ticks on DOE Natural Gas Storage Report data on 18 July 2024.

Natural gas (32 ticks)

Charts are exported from JForex (Dukascopy).


Weekly Natural Gas Storage Update - July 18, 2024

The latest data from the Energy Information Administration (EIA) provides an insightful snapshot into the state of natural gas storage across the United States as of the week ending July 12, 2024. Let’s dive into the numbers and understand what they signify for the energy sector and, more broadly, for the economy.

Current Natural Gas Storage Figures

As per the EIA report released today, total working gas in underground storage stood at 3,209 billion cubic feet (Bcf) as of July 12, 2024. This represents a slight increase of 10 Bcf from the previous week. When compared to the figures from the same time last year, the current storage levels are 250 Bcf higher. Moreover, they surpass the five-year average (2019-2023) by 465 Bcf. This indicates a robust inventory that exceeds typical seasonal levels.

Here's a regional breakdown of the storage data:

  • East: Current stocks are at 686 Bcf, showing a minor weekly increase and being notably higher than both last year’s and the five-year average figures.

  • Midwest: Stocks increased by 14 Bcf over the week, totaling 814 Bcf. This region also exhibits a strong year-on-year growth and significantly outpaces the five-year average.

  • Mountain: Storage stands at 248 Bcf, with a weekly increase and dramatic increases over past figures, reflecting perhaps the most substantial relative growth among the regions.

  • Pacific: Stable week-over-week at 289 Bcf but substantially higher than previous year and five-year averages.

  • South Central: This region saw a decrease in storage, mainly in the salt facilities, which might indicate specific regional dynamics such as increased withdrawals or decreased injections.

Analysis

The overall increase in natural gas stocks can be attributed to a combination of factors including mild weather reducing heating demand, efficient production rates, and possibly strategic injections anticipating future demand. The substantial surplus relative to both last year and the five-year average provides a cushion that might help in stabilizing natural gas prices, offering some relief to consumers and industries reliant on natural gas.

However, the regional variations highlight different dynamics possibly driven by local weather conditions, demand fluctuations, and infrastructural factors. For instance, the notable increase in the Mountain region might reflect specific local market conditions or response strategies to anticipated regional demand.

Market Implications

Higher-than-average gas storage levels typically exert downward pressure on natural gas prices due to the law of supply and demand. Investors and market analysts closely watch these figures as they can influence not only energy markets but also broader economic conditions. Lower natural gas prices can reduce energy costs for industries and households, contributing to lower overall inflationary pressures in the economy.

Looking Ahead

The next update is scheduled for July 25, 2024. Market participants will be keen to see if the trend of building inventories continues or if there are shifts in the pattern that could suggest changes in market dynamics. Meanwhile, stakeholders would do well to monitor weather forecasts and any geopolitical developments that could impact energy markets.

In conclusion, this week's report underscores a strong position for natural gas storage, which could bode well for maintaining energy security and economic stability in the upcoming months. As always, it will be important to monitor these trends closely to adapt to the ever-evolving energy landscape.

Source: https://ir.eia.gov/ngs/ngs.html


Start futures forex fx commodity news trading with Haawks G4A low latency machine-readable data, one of the fastest data feeds for DOE data.

Please let us know your feedback. If you are interested in timestamps, please send us an email to sales@haawks.com.

Comment

Share

Comment

Share

40 pips potential profit in 5 seconds on 16 July 2024, analysis on futures forex fx news trading USDJPY and EURUSD on US Retail Sales data

According to our analysis USDJPY and EURUSD moved 40 pips on US Retail Sales data on 16 July 2024.

USDJPY (29 pips)

EURUSD (11 pips)

Charts are exported from JForex (Dukascopy).


Analyzing the Latest U.S. Retail and Food Services Sales Data for June 2024

In the latest release from the U.S. Census Bureau, the advance estimates for retail and food services sales in June 2024 presented a mixed bag of results that offer insights into consumer spending habits and economic trends. According to the report, total sales amounted to $704.3 billion, showing no significant change from May 2024 but reflecting a moderate increase of 2.3 percent from June 2023.

A Closer Look at the Numbers

The data, adjusted for seasonal variations and differences in trading days and holidays, provides a clear picture of the market's stability and growth over the past year. Despite the static growth from the previous month, there is a positive uptrend when comparing the data year-over-year. From April to June 2024, total sales saw an increase of 2.5 percent from the same period last year, indicating a steady rise in consumer expenditure.

Interestingly, the April to May 2024 data was revised upward, from a marginal 0.1 percent increase to a more noticeable 0.3 percent. This revision suggests that consumer spending has been slightly more robust than initially estimated.

Sector-Specific Trends

The retail trade sector specifically showed a minor decline of 0.1 percent from May 2024, yet it experienced a 2.0 percent increase compared to last year. This suggests a slow but steady recovery and growth over the long term. Nonstore retailers, which include online and e-commerce platforms, notably outperformed other categories with an impressive 8.9 percent increase from June 2023. This highlights the continuing shift towards online shopping and the strength of digital marketplaces.

On the other hand, food services and drinking places also saw a significant uptick, with sales rising by 4.4 percent from the previous year. This increase may be indicative of a rebound in dining out as consumer confidence in public health safety grows and social restrictions related to the pandemic continue to ease.

What This Means for the Economy

The mixed signals from the June 2024 data reflect the complex interplay of economic recovery, inflation concerns, and shifts in consumer behavior. The stability in month-over-month sales juxtaposed with the annual increases suggests that while the market is not booming, it is resilient amid economic uncertainties.

For investors and business owners, these trends underscore the importance of adjusting to the growing online consumer base and the recovering food service industry. Businesses that can navigate the balance between digital and physical sales channels are likely to see continued success.

Final Thoughts

As we move further into the second half of 2024, all eyes will be on how these trends develop, particularly in the context of economic policies and global market conditions. Will the momentum in nonstore retail and food services continue? How will macroeconomic factors like inflation and employment rates affect consumer spending?

These are critical questions for market analysts, investors, and policymakers as they plan for the coming months. Keeping a close eye on these trends will be key to understanding and anticipating the needs of the U.S. consumer in a rapidly evolving economic landscape.

Source: https://www.census.gov/retail/sales.html


Please let us know your feedback. If you are interested in timestamps, please send us an email to sales@haawks.com.

Start futures forex fx news trading with Haawks G4A low latency machine-readable data today, one of the fastest news data feeds for US macro-economic and commodity data.

Comment

Share

40 ticks potential profit on 12 July 2024, analysis on trading corn futures on USDA WASDE data

Comment

Share

40 ticks potential profit on 12 July 2024, analysis on trading corn futures on USDA WASDE data

According to our analysis corn (ZC) futures prices moved around 40 ticks on USDA WASDE (World Agricultural Supply and Demand Estimates) and USDA Grain Stocks data on 12 July 2024.


The JULY WASDE Report: Implications for Global Agriculture Markets

The recently released World Agricultural Supply and Demand Estimates (WASDE) report for July 2024 provides crucial insights into the agricultural sector, forecasting trends for commodities like wheat, coarse grains, and oilseeds. These projections not only shape farming strategies but also have significant implications for traders, policymakers, and global markets. Let's delve into the key points from the report and their potential impact.

Wheat: Surplus Production with Lower Prices

The 2024/25 outlook for U.S. wheat indicates an increase in supplies, exports, and ending stocks. Production is expected to rise substantially, with all wheat production increasing by 134 million bushels to 2,008 million. This increase is attributed to larger harvested areas and higher yields, with significant rises noted in both spring wheat and winter wheat production.

Globally, the wheat supply is set to increase by 6.9 million tons, driven by higher production in the United States, Pakistan, and Canada. Pakistan’s wheat production is forecasted to reach a record 31.4 million tons. This surplus in production is likely to push down prices; the season-average farm price for wheat is projected to decrease by $0.80 per bushel to $5.70.

Coarse Grains: Corn Leads with Strong Production

The U.S. corn market is also looking robust with projections indicating larger supplies and increased domestic use and exports, although ending stocks are slightly lower. Corn production is expected to rise by 240 million bushels, with total use increasing by 100 million bushels due to greater feed and residual use and exports. This is likely to decrease the season-average farm price by 10 cents to $4.30 per bushel.

On the international front, the coarse grain outlook is mixed, with reductions in foreign corn production in the EU, Canada, and Russia due to challenging weather conditions. However, global corn exports for 2024/25 have shifted, favoring the United States, while imports are up for Canada and Mexico.

Oilseeds: A Slight Downturn with a Steady Outlook

The U.S. oilseed production for 2024/25 is projected at 131.5 million tons, with minor adjustments across various seeds. Soybean production is down by 15 million bushels due to a lower harvested area, which might lead to a slight decrease in ending stocks. The season-average soybean price is forecasted at $11.10 per bushel, a slight decrease from previous estimates.

Globally, soybean stocks are slightly down by 0.1 million tons, with notable decreases in Argentina, Brazil, and the EU. This is contrasted by increased soybean imports for China, suggesting a larger demand within the Asian markets.

Market Implications and Strategic Moves

  • Farmers and Agricultural Producers: The increased production in both wheat and corn suggests that farmers might benefit from expanding their acreage or investing in technologies to enhance yield. However, they must also prepare for potential price drops due to higher supply.

  • Traders and Investors: The shifts in global supply and demand provide trading opportunities, particularly in commodities with significant changes in stock levels or production forecasts. Diversifying portfolios to include commodities with expected price increases or stable markets could be beneficial.

  • Policymakers and Economic Planners: Ensuring stability in local markets despite global fluctuations will be crucial. Policies aimed at supporting domestic agriculture during times of excess global supply could help mitigate adverse effects on local farmers.

Conclusion

The July WASDE report paints a complex picture of the global agricultural landscape, characterized by increased production and varying market dynamics across different commodities. Stakeholders across the spectrum, from farmers to policymakers, must stay informed and agile to navigate these changes effectively. As always, the key to success in agriculture lies in strategic planning and adaptability to ever-changing market conditions.

Source: https://www.usda.gov/oce/commodity/wasde/wasde0724.pdf


Haawks G4A is one of the fastest machine-readable data feeds for USDA data. We are beating big names in the industry by seconds. Coverage includes monthly USDA WASDE (World Agricultural Supply and Demand Estimates), quarterly USDA Grain Stocks and yearly USDA Prospective Plantings and USDA Acreage.

Please let us know your feedback. If you are interested in timestamps, please send us an email to sales@haawks.com.

Comment

Share

Comment

Share

32 pips potential profit in 69 seconds on 11 July 2024, analysis on futures forex fx low latency news trading USDJPY and EURUSD on US BLS Consumer Price Index (CPI) data

According to our analysis USDJPY and EURUSD moved 32 pips on US BLS Consumer Price Index (CPI) data on 11 July 2024.

USDJPY (12 pips)

EURUSD (20 pips)

Charts are exported from JForex (Dukascopy).


Navigating the Economic Waves: A Deep Dive into the June 2024 Consumer Price Index Report

The U.S. Bureau of Labor Statistics (BLS) recently released its Consumer Price Index (CPI) report for June 2024, revealing a nuanced snapshot of the current economic environment. The report, which saw a slight decline of 0.1% on a seasonally adjusted basis from the previous month, offers valuable insights into the shifting dynamics of consumer prices in the U.S. economy.

Key Highlights of the June 2024 CPI Report

The all items index, which measures a broad spectrum of consumer goods and services, rose by 3.0 percent over the last 12 months. This increment, though modest, indicates a slowdown from the 3.3 percent increase observed at the end of May 2024. Here's a closer look at some specific segments:

  • Energy: The index for gasoline plummeted by 3.8 percent in June, mirroring a similar drop in May. This continued decline significantly contributed to the overall decrease in the energy index, which also fell by 2.0 percent over the month.

  • Food: Contrary to the energy sector, food prices saw a slight increase. The overall food index rose by 0.2 percent, with the food away from home index up by 0.4 percent. This indicates sustained demand and perhaps a bit of resilience in the food sector despite broader economic conditions.

  • Core Inflation: When stripping out volatile food and energy prices, the core CPI (all items less food and energy) inched up by 0.1 percent in June. Notably, this represents the smallest monthly increase since August 2021, signaling a potential cooling of underlying inflationary pressures.

Sector-Specific Analysis

The shelter index continues to be a significant driver of the core inflation, despite only increasing by 0.2 percent in June. This subtle rise is the smallest since August 2021, potentially indicating a cooling in the housing market. Meanwhile, the indexes for motor vehicle insurance, household furnishings, and personal care all rose, underscoring that some areas of the economy are still experiencing upward price pressures.

Transportation services saw some of the most substantial fluctuations, particularly airline fares, which tumbled by 5.0 percent in June after a 3.6-percent decline in May. This drop could be reflecting seasonal adjustments or broader changes in consumer travel behavior.

Economic Implications and Consumer Impact

The latest CPI data suggests a mixed bag of economic signals. While the decline in energy prices can offer some relief to consumers, the rise in food and shelter costs could offset these benefits. Additionally, the modest rise in core CPI indicates that while inflationary pressures may be cooling, they remain present, affecting the cost of living and potentially influencing future monetary policy decisions.

For consumers, understanding these trends is crucial. Those planning budgets or major purchases will find it beneficial to track such indices closely, as they directly impact everyday expenses. On a broader scale, these trends also provide insight into the health of the U.S. economy, offering clues about potential future actions by policymakers, such as interest rate adjustments by the Federal Reserve.

Looking Ahead

As we move into the second half of 2024, all eyes will be on the upcoming July CPI report, due for release on August 14. Will the trend of modest increases continue, or will we see a reversal in certain sectors? Only time will tell, but for now, consumers and economists alike should remain vigilant, monitoring these indicators closely as they navigate the complex landscape of the U.S. economy.

In conclusion, the June 2024 CPI report paints a picture of an economy experiencing varied sectoral dynamics, highlighting the importance of nuanced analysis in understanding the overall economic health and making informed decisions.

Source: https://www.bls.gov/news.release/cpi.nr0.htm


Start futures forex fx news trading with Haawks G4A low latency machine-readable data, one of the fastest machine-readable news trading feed for US economic and commodity data.

Please let us know your feedback. If you are interested in timestamps, please send us an email to sales@haawks.com.

Comment

Share

Comment

Share

44 pips potential profit in 42 seconds on 13 June 2024, analysis on futures forex fx low latency news trading USDJPY and EURUSD on US BLS Producer Price Index (PPI) data

According to our analysis USDJPY and EURUSD moved 44 pips on US Jobless Claims and US BLS Producer Price Index (PPI) data on 13 June 2024.

USDJPY (29 pips)

EURUSD (15 pips)

Charts are exported from JForex (Dukascopy).


Analyzing the Dip: A Closer Look at the May 2024 Producer Price Index Report

The U.S. Bureau of Labor Statistics' latest release of the Producer Price Index (PPI) for May 2024 presents some intriguing shifts in the economic landscape. The report, detailing the movements in prices from a producer's perspective, shows a decline in final demand by 0.2 percent. This is particularly notable following a 0.5 percent increase in April and a slight decrease in March. Over the past 12 months, however, the index for final demand has advanced 2.2 percent on an unadjusted basis.

Key Highlights from the May 2024 PPI Report

Decline in Final Demand Goods: The report indicates a significant 0.8 percent drop in final demand goods, marking the largest decline since October 2023. A major contributor to this decrease was the energy sector, which plummeted by 4.8 percent. This sharp decline in energy prices, particularly a 7.1-percent decrease in gasoline prices, heavily influenced the overall drop in goods prices.

Stability in Services: In contrast to goods, prices for final demand services remained unchanged in May, after a rise in the previous month. Within the services category, trade services and services excluding trade, transportation, and warehousing saw minor increases of 0.2 percent and 0.1 percent, respectively. However, transportation and warehousing services experienced a notable drop of 1.4 percent.

Intermediate Demand: Intermediate demand also saw significant shifts, with processed goods for intermediate demand falling by 1.5 percent, driven largely by an 8.0 percent decline in processed energy goods. On the other hand, unprocessed goods for intermediate demand declined by 1.8 percent, largely due to a 6.6 percent drop in unprocessed energy materials.

Economic Implications

The decline in the PPI for May underscores several key economic trends and potential implications:

  1. Energy Sector Volatility: The substantial decrease in energy prices, especially gasoline and diesel, suggests volatility in the energy sector, which could be due to fluctuating global oil prices or changes in domestic production and inventory levels.

  2. Inflationary Pressures: While final demand goods prices have fallen, the unchanged prices in services indicate sustained demand and potentially ongoing inflationary pressures in parts of the economy not directly impacted by energy costs.

  3. Sector-Specific Impacts: The mixed performance across different sectors highlights the uneven recovery and challenges facing various industries. For example, while the food and alcohol retailing segments saw price increases, airline services and machinery and vehicle wholesaling faced declines.

Looking Ahead

As businesses and policymakers digest these figures, the PPI provides crucial insights into the pressures faced by producers which can eventually trickle down to consumer prices. The stability in services despite the drop in goods prices may cushion the overall economic impact in the short term. However, the ongoing volatility in energy prices remains a wild card that could influence future economic conditions.

In conclusion, the May PPI report serves as a vital barometer for economic health, offering a glimpse into the dynamics affecting producers that could shape policy decisions and market strategies in the coming months. With the next PPI release scheduled for July 12, 2024, all eyes will be on whether these trends continue, stabilize, or reverse, setting the stage for mid-year economic forecasts.

Source: https://www.bls.gov/news.release/ppi.nr0.htm


Start futures forex fx news trading with Haawks G4A low latency machine-readable data, one of the fastest machine-readable news trading feed for US economic and commodity data.

Please let us know your feedback. If you are interested in timestamps, please send us an email to sales@haawks.com.

Comment

Share

Comment

Share

62 pips potential profit in 45 seconds on 12 June 2024, analysis on futures forex fx low latency news trading USDJPY and EURUSD on US BLS Consumer Price Index (CPI) data

According to our analysis USDJPY and EURUSD moved 62 pips on US BLS Consumer Price Index (CPI) data on 12 June 2024.

USDJPY (37 pips)

EURUSD (25 pips)

Charts are exported from JForex (Dukascopy).


Understanding the Consumer Price Index for May 2024: Insights and Implications

The recent release of the Consumer Price Index (CPI) data for May 2024 by the U.S. Bureau of Labor Statistics offers a detailed glimpse into the economic trends and consumer pricing landscape. Notably, the CPI for All Urban Consumers (CPI-U) remained unchanged in May, after a modest increase of 0.3 percent in April. Over the past 12 months, the overall index has seen an increase of 3.3 percent before seasonal adjustment.

Key Highlights from the May 2024 CPI Data:

  • Stable Consumer Prices: The overall stability in the CPI-U in May contrasts with the previous month's rise, reflecting a balance between sectors where prices increased and those that saw declines.

  • Shelter Costs Continue to Climb: The shelter index rose by 0.4 percent, maintaining the same growth rate for four consecutive months, which indicates a persistent upward pressure on housing costs.

  • Divergence in Food Prices: While the overall food index nudged up by 0.1 percent, significant variation was observed within this category. The food away from home index increased by 0.4 percent, in contrast to the unchanged status of the food at home index.

  • Decrease in Energy Prices: The energy index decreased by 2.0 percent in May, driven by a substantial 3.6 percent drop in the gasoline index. This decline helped offset some of the rising costs in other areas.

Detailed Analysis:

  1. Sector-Specific Trends:

    • Energy: The sharp decline in gasoline prices significantly impacted the energy sector, which saw an overall decline despite previous increases. This decrease in energy costs, while beneficial in curbing overall inflation, raises questions about the volatility in energy markets.

    • Food: The modest increase in the food index is reflective of a relatively stable food pricing environment, although variations exist between dining out and eating at home, with the former experiencing higher inflation.

    • Healthcare and Education: Both sectors saw increases, with medical care rising by 0.5 percent in May and education by 0.4 percent, indicating ongoing cost pressures in these essential services.

  2. Economic Implications:

    • The stability in the CPI indicates a balancing act between rising and falling sectors, suggesting that while certain costs continue to rise, overall inflation pressures are being moderated by declines in other areas like energy.

    • The persistent increase in shelter costs is a concern for long-term affordability and living standards, particularly in urban areas where CPI measurements are most applicable.

  3. What to Watch:

    • Future Energy Prices: Given the volatility in the energy sector, future reports should be closely monitored to gauge whether May’s decrease in energy prices is a temporary dip or the start of a longer-term trend.

    • Food and Shelter Costs: As these are significant components of the CPI and directly impact consumer budgets, ongoing increases could pose challenges for consumer spending power.

Conclusion:

The May 2024 CPI report highlights the complex interplay of various economic factors influencing consumer prices. With the index for all items less food and energy rising modestly, it’s crucial for policymakers and consumers alike to monitor these trends closely, particularly as they relate to the cost of living and inflation expectations.

Looking ahead, the next CPI release scheduled for July will provide further insights into whether these trends are solidifying, offering a clearer picture of the economic direction in the second half of 2024. For now, consumers and analysts alike would do well to keep an eye on the evolving economic landscape, especially in sectors like energy, food, and housing, which are crucial to everyday financial planning and policy formulation.

Source: https://www.bls.gov/news.release/cpi.nr0.htm


Start futures forex fx news trading with Haawks G4A low latency machine-readable data, one of the fastest machine-readable news trading feed for US economic and commodity data.

Please let us know your feedback. If you are interested in timestamps, please send us an email to sales@haawks.com.

Comment

Share

Comment

Share

58 pips potential profit in 39 seconds on 7 June 2024, analysis on forex fx futures news trading USDJPY and EURUSD on US Employment Situation (Non-farm payrolls/NFP) data

According to our analysis USDJPY and EURUSD moved around 58 pips on US Employment Situation (Non-farm payrolls / NFP) data on 7 June 2024.

USDJPY (38 pips)

EURUSD (20 pips)

Charts are exported from JForex (Dukascopy).


Analyzing the May 2024 U.S. Employment Report: Trends and Implications

The latest Employment Situation Summary released by the U.S. Bureau of Labor Statistics provides an insightful glimpse into the current state of the nation's job market as of May 2024. A robust addition of 272,000 jobs indicates continuing growth across multiple sectors, maintaining a stable unemployment rate of 4.0 percent. This post delves into the details of the report, highlighting key trends and what they might mean for the economy and job seekers.

Key Highlights from the May 2024 Report

  • Continued Growth in Key Sectors: The health care, government, leisure and hospitality, and professional, scientific, and technical services sectors led job additions for the month. Notably, health care saw an addition of 68,000 jobs, aligning with its average monthly gain, signaling ongoing robust demand in this sector.

  • Stable Unemployment Rates: The unemployment rate held steady at 4.0 percent, with little change across major worker groups. Adult men and women posted unemployment rates of 3.8 percent and 3.4 percent respectively, while the unemployment rate for teenagers was significantly higher at 12.3 percent.

  • Part-Time and Marginal Attachments: Approximately 4.4 million individuals were employed part-time for economic reasons, unchanged from the previous month. Additionally, 1.5 million people were marginally attached to the labor force, including 462,000 discouraged workers who believe no jobs are available for them.

Economic Trends and Labor Market Dynamics

The stability in unemployment rates combined with significant job growth in sectors like health care and technical services suggests a maturing recovery phase as the economy rebounds from previous disruptions. The consistency in sectors like health care underscores the critical demand for healthcare services, possibly driven by an aging population and greater health consciousness post-pandemic.

Government job increases also reflect ongoing public sector investments, which often provide a stabilizing effect on employment during economic fluctuations. Meanwhile, the leisure and hospitality sector's recovery is indicative of restored consumer confidence and spending levels.

Challenges and Opportunities

Despite the overall positive outlook, there remain areas of concern, such as the high unemployment rate among teenagers and the substantial number of individuals working part-time due to economic conditions. These issues highlight the need for targeted policy interventions, such as improved job training and education programs, especially for younger workers.

The slight increase in discouraged workers also suggests that some segments of the population are not feeling the benefits of economic recovery, possibly due to skills mismatches or geographic disparities in job availability.

Forward Outlook

Looking ahead, the labor market appears to be on a stable trajectory, but with some areas needing attention to ensure broader participation and benefits from economic growth. Employers and policymakers alike should focus on inclusive growth strategies that address the needs of the most vulnerable populations.

The next Employment Situation Summary, slated for release in early July, will be closely watched for signs of whether these trends continue, especially in terms of wage growth and labor force participation rates.

Overall, the May 2024 employment report paints a picture of a resilient U.S. job market, with ongoing opportunities tempered by challenges that need to be managed to sustain long-term economic health.

Source: https://www.bls.gov/news.release/empsit.nr0.htm


Start forex fx futures news trading with Haawks G4A low latency machine-readable data today, one of the fastest news data feeds for US economic and commodity data.

Please let us know your feedback. If you are interested in timestamps, please send us an email to sales@haawks.com.

Comment

Share

Comment

Share

40 ticks potential profit in 37 seconds on 6 June 2024, analysis on futures forex fx news trading natural gas on DOE Natural Gas Storage Report data

According to our analysis natural gas moved 40 ticks on DOE Natural Gas Storage Report data on 6 June 2024.

Natural gas (40 ticks)

Charts are exported from JForex (Dukascopy).


Weekly Update on U.S. Natural Gas Storage: Trends and Insights as of May 31, 2024

As we close another week, the U.S. Energy Information Administration (EIA) has released its latest Natural Gas Storage Report. This week's data, ending on May 31, 2024, reveals significant trends in the storage of working gas, reflecting both seasonal influences and broader market dynamics.

Current Storage Figures and Regional Breakdown

As of May 31, total working gas in underground storage across the Lower 48 states stood at 2,893 billion cubic feet (Bcf). This is a robust increase of 98 Bcf from the previous week. When we delve into regional data, the distribution and changes become even more insightful:

  • East: Stocks reached 575 Bcf, with an impressive weekly increase of 37 Bcf.

  • Midwest: Storage levels rose to 681 Bcf, marking a rise of 29 Bcf over the last week.

  • Mountain: Smaller but still significant, stocks are at 218 Bcf, up 8 Bcf.

  • Pacific: Recorded a modest rise of 6 Bcf to reach 273 Bcf.

  • South Central: Demonstrating the largest regional storage, totals hit 1,146 Bcf, with an increase of 18 Bcf.

These figures underscore a noteworthy increase in storage levels across most regions, particularly in areas like the Pacific and Mountain regions, where percentage increases far outpace other regions.

Historical Comparisons and Market Implications

The current total storage of 2,893 Bcf not only surpasses last week's figures but also shows significant gains over historical benchmarks. This total is 373 Bcf higher than the same time last year and 581 Bcf above the five-year average of 2,312 Bcf. Such a position above the historical average suggests a robust supply scenario which could influence market sentiments and pricing strategies in the natural gas markets.

  • Year-over-Year: Each region has shown growth compared to last year, with the Mountain and Pacific regions reporting the most substantial relative increases (62.7% and 70.6%, respectively).

  • Against the Five-Year Average: Here too, the Mountain and Pacific regions standout with increases of 67.7% and 21.3%, respectively, showcasing a trend of growing stockpiles that may impact future supply availability and pricing.

Statistical Considerations

The EIA report also touches on the accuracy and reliability of these figures. The coefficients of variation (CV) for stocks indicate the reliability of the reported quantities. For most regions, the CV remains low, suggesting a high level of confidence in these measurements. Particularly notable is the Pacific region's 0.0% CV, indicating highly reliable data.

Market Outlook

Given the current data, market participants might anticipate stable or potentially lower natural gas prices, barring any unforeseen shifts in market demand or supply disruptions. The significant increase above the five-year average provides a cushion that could help mitigate price volatility in the short term.

In conclusion, the latest report on natural gas storage indicates a healthy supply situation in the U.S. As we head into the summer months, where consumption typically rises, the industry appears well-prepared to meet demand. However, stakeholders should continue to monitor weekly trends and other market indicators to refine their strategies in this dynamic market environment.

Source: https://ir.eia.gov/ngs/ngs.html


Start futures forex fx commodity news trading with Haawks G4A low latency machine-readable data, one of the fastest data feeds for DOE data.

Please let us know your feedback. If you are interested in timestamps, please send us an email to sales@haawks.com.

Comment

Share

Comment

Share

20 pips potential profit in 13 seconds on 31 May 2024, analysis on futures forex fx news trading USDJPY and EURUSD on US BEA Personal Income and Outlays (PIO)

According to our analysis USDJPY and EURUSD moved 20 pips on US BEA Personal Income and Outlays and US Durable Goods Orders data on 31 May 2024.

USDJPY (10 pips)

EURUSD (10 pips)

Charts are exported from JForex (Dukascopy).


Analyzing the Latest Personal Income and Outlays Report for April 2024

The Bureau of Economic Analysis (BEA) recently released the Personal Income and Outlays report for April 2024, revealing significant insights into the current economic trends and consumer behavior. Here's a breakdown of the key findings and what they mean for the economy.

Key Highlights from April 2024

  • Personal Income and Disposable Income: Personal income in April saw a moderate increase of $65.3 billion or 0.3 percent, which aligns with the growth trends observed in recent months. Disposable personal income (DPI), which is what people have left to spend after taxes, also rose by $40.2 billion or 0.2 percent. These figures suggest a steady income flow but also hint at the rising tax burdens consumers are facing.

  • Consumer Spending: Personal consumption expenditures (PCE) increased by $39.1 billion, a growth of 0.2 percent from the previous month. This increase is relatively modest, indicating that while consumers are spending, there is caution in the air possibly due to inflationary pressures.

  • Inflation and Prices: The PCE price index, which measures the average change in prices paid by consumers, increased by 0.3 percent in April. Excluding food and energy, core inflation was slightly lower at 0.2 percent. On an annual basis, the PCE price index has increased by 2.7 percent, and core inflation stands at 2.8 percent. These figures are crucial for the Federal Reserve's monitoring of inflation dynamics.

  • Sector-Specific Insights: The report detailed changes in spending across various sectors. Spending on services rose by $49.1 billion, led by increases in housing, healthcare, and financial services. However, there was a $10.0 billion decline in goods spending, driven by decreases in recreational goods and vehicles.

  • Savings and Outlays: The personal saving rate was recorded at 3.6 percent, indicating that consumers are saving a smaller portion of their income compared to previous periods. Total personal outlays, which include spending and other payments like interest and transfers, grew by $42.8 billion.

Economic Implications

The moderate growth in personal income and consumption, combined with stable inflation rates, suggests that the economy is on a steady path, albeit with underlying caution among consumers. The disparities in spending between goods and services highlight shifting consumer preferences, possibly influenced by long-term changes brought about by the pandemic and current economic policies.

Inflation remains a critical watchpoint. While the core inflation rate is stable, continued increases in energy prices and certain service sectors could prompt a reevaluation of spending and saving strategies among consumers.

Forward Look

As we move deeper into 2024, the interplay between income growth, inflation, and consumer spending will be pivotal in shaping economic policies and consumer confidence. The next release of this report, scheduled for June 28, 2024, will be crucial for understanding if these trends are merely a blip or the beginning of a more significant shift in the economic landscape.

Overall, while the economy shows signs of resilience, the balance between spending and saving, alongside inflation management, will dictate the pace of economic recovery and growth in the coming months.

Source: https://www.bea.gov/news/2024/personal-income-and-outlays-april-2024


Start futures #forex fx news #trading with Haawks G4A low latency machine-readable data today, one of the fastest news data feeds for US economic and commodity data.

Please let us know your feedback. If you are interested in timestamps, please send us an email to sales@haawks.com.

Comment

Share