Blog — HAAWKS

Viewing entries tagged
jobless claims

Comment

Share

12 pips potential profit in 8 seconds on 14 May 2024, analysis on futures forex fx low latency news trading USDJPY and EURUSD on US BLS Producer Price Index (PPI) data

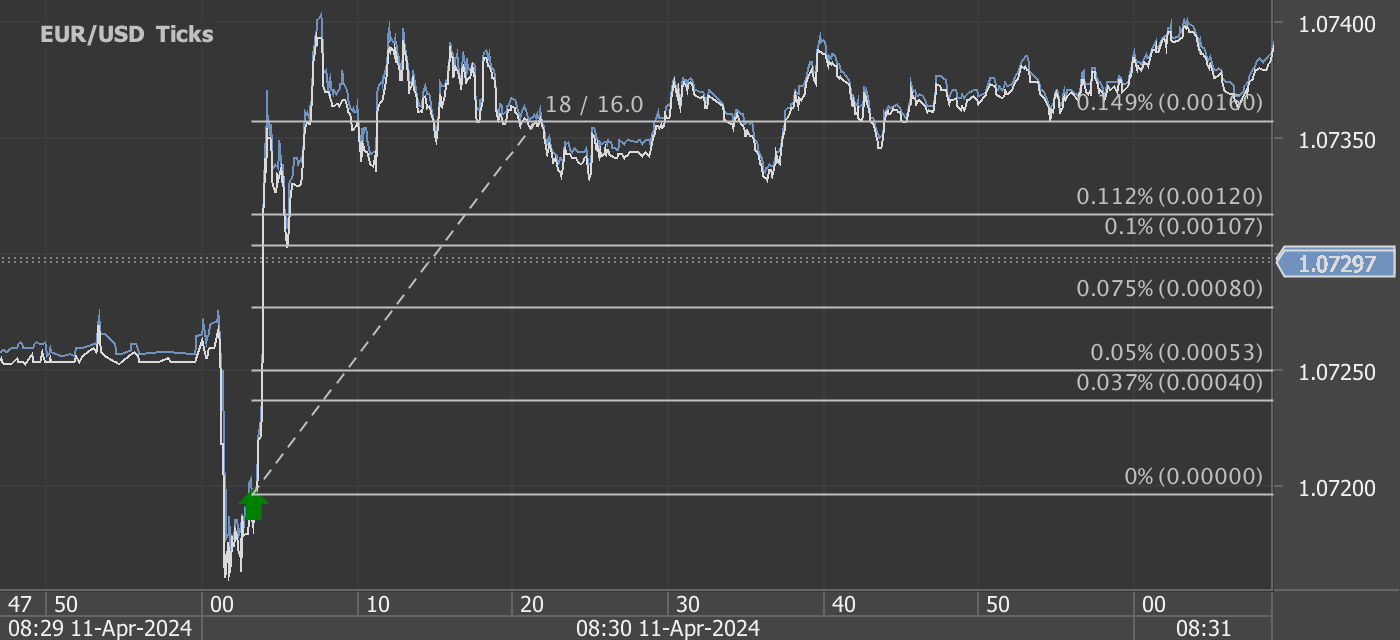
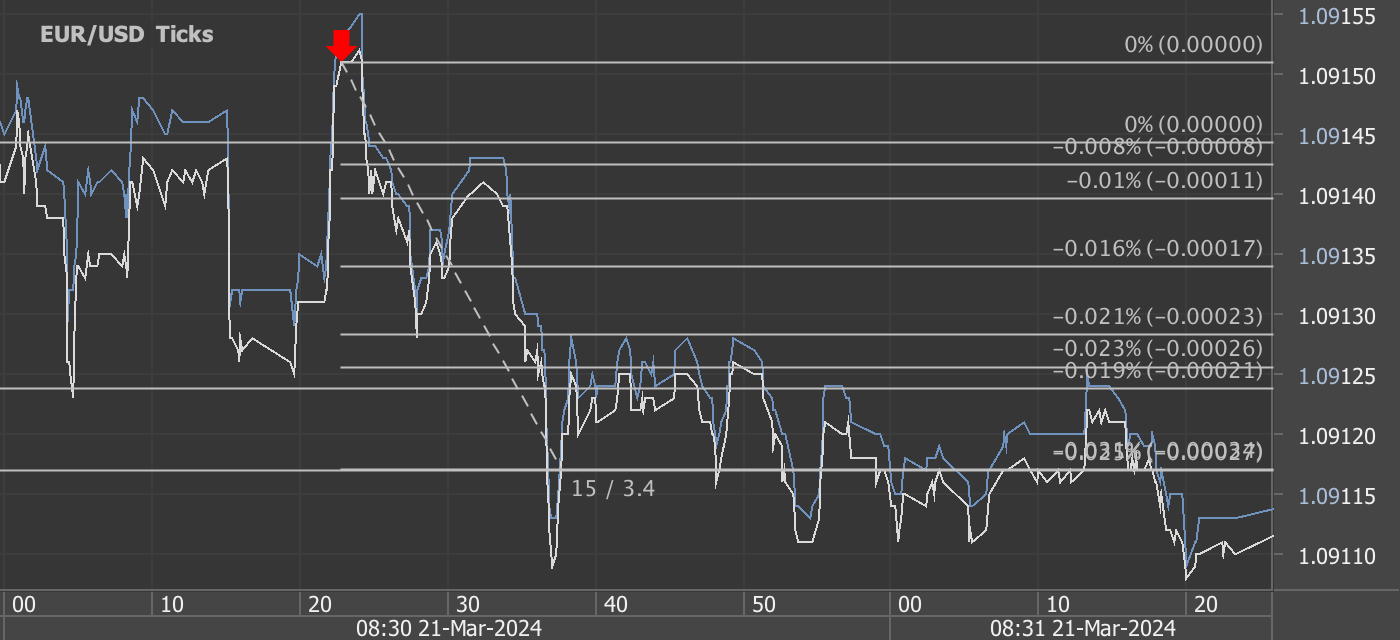
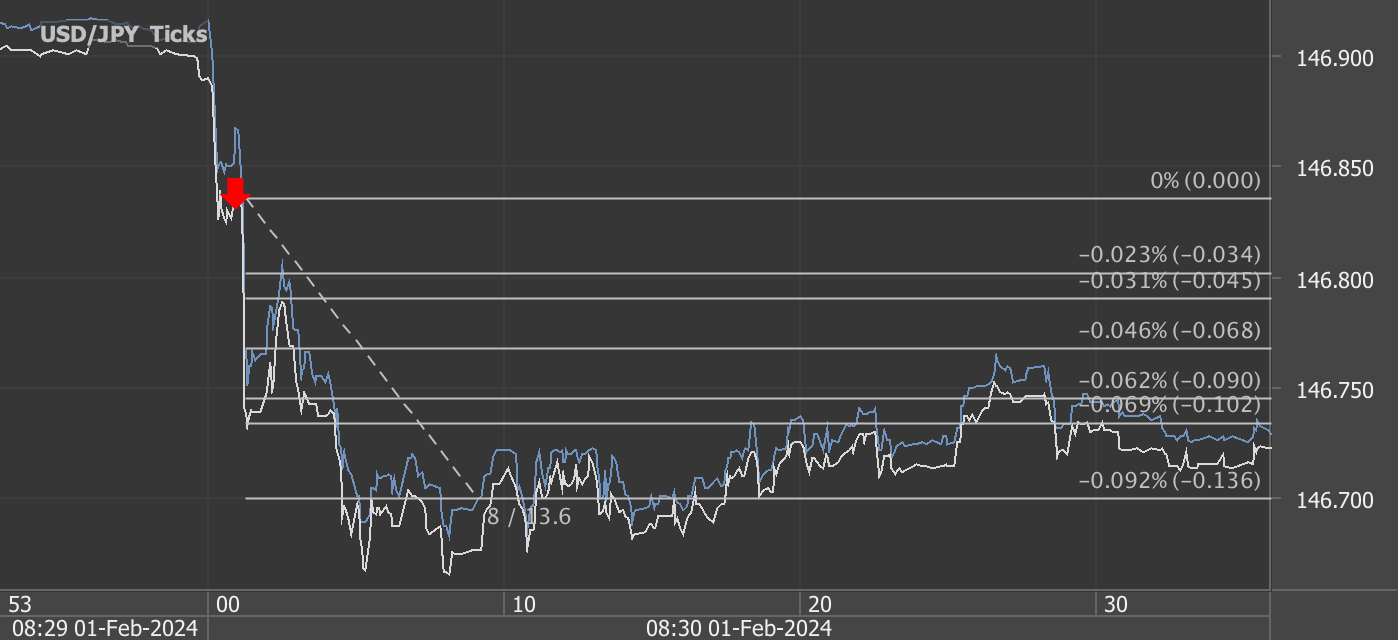
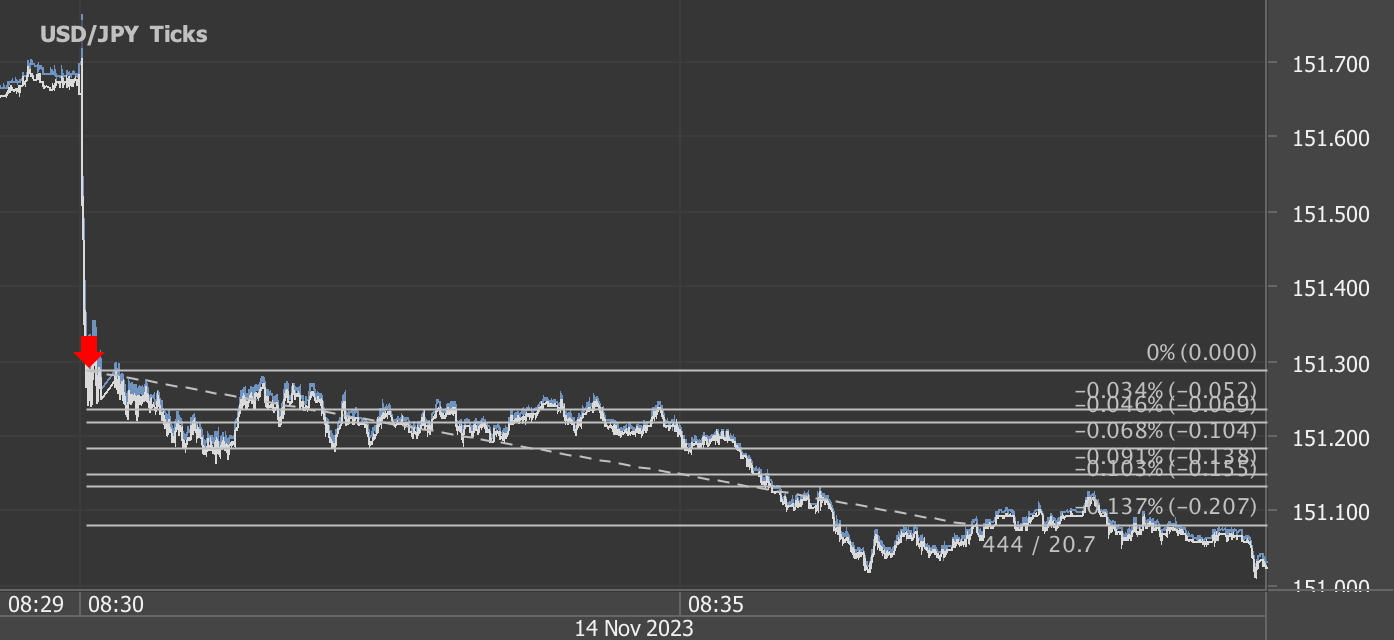
According to our analysis USDJPY and EURUSD moved 12 pips on US BLS Producer Price Index (PPI) data on 14 May 2024.

USDJPY (3 pips)

EURUSD (9 pips)

Charts are exported from JForex (Dukascopy).


Analyzing the April 2024 Producer Price Index (PPI) Increase: Key Takeaways and Economic Implications

The U.S. Bureau of Labor Statistics recently released the Producer Price Index (PPI) for April 2024, revealing a notable uptick of 0.5 percent on a seasonally adjusted basis. This increase comes after a slight decline of 0.1 percent in March and marks the largest rise since February's 0.6 percent gain. Over the past 12 months, the unadjusted index for final demand has risen by 2.2 percent, representing the most substantial annual increase since April 2023.

Breakdown of Key Components

1. Services Drive the Increase

Nearly three-quarters of April's rise can be attributed to the services sector, which saw a 0.6 percent increase, primarily driven by a significant 3.9 percent jump in portfolio management costs. Other contributing factors include higher prices in machinery and equipment wholesaling, residential real estate services, and truck transportation of freight.

2. Goods Also Up

Final demand goods increased by 0.4 percent, primarily due to a 5.4 percent rise in gasoline prices, which accounted for most of the increase. Despite this, there was a contrasting decline in food prices, notably a steep 18.7 percent drop in fresh and dry vegetables.

Deeper Insights: Excluding Volatile Sectors

When excluding foods, energy, and trade services, the index still shows a robust increase of 0.4 percent in April, following a 0.2 percent rise in March. This indicator is particularly telling as it excludes sectors that are typically volatile, providing a clearer picture of the underlying inflation trends. Year-over-year, this measure has seen a 3.1 percent increase, the largest since April 2023.

Implications for Economic Policy and Business Planning

The latest PPI data suggests underlying inflationary pressures in the economy, particularly in the services sector. Businesses, especially in sectors directly impacted by rising service costs, will need to adjust their pricing strategies and budgeting plans to accommodate these cost increases. Moreover, policymakers may need to consider these trends when designing monetary policy to ensure inflation targets are met without stifling economic growth.

Future Outlook

Given the PPI's role as a leading indicator of consumer price inflation, the April increase might signal upcoming changes in consumer prices, potentially affecting the Federal Reserve's decisions on interest rates. The economic landscape remains dynamic, and these price trends provide critical insights into the broader economic health.

As we look forward to the May 2024 PPI report scheduled for release on June 13, businesses and policymakers alike must stay vigilant and responsive to these evolving economic indicators.

This data not only helps in anticipating economic trends but also serves as a crucial tool for financial planning and analysis, ensuring stakeholders are well-prepared to navigate the complexities of an ever-changing economic environment.

Source: https://www.bls.gov/news.release/ppi.nr0.htm


Start futures forex fx news trading with Haawks G4A low latency machine-readable data, one of the fastest machine-readable news trading feed for US economic and commodity data.

Please let us know your feedback. If you are interested in timestamps, please send us an email to sales@haawks.com.

Comment

Share

Comment

Share

35 pips potential profit in 18 seconds on 11 April 2024, analysis on futures forex fx low latency news trading USDJPY and EURUSD on US BLS Producer Price Index (PPI) data

According to our analysis USDJPY and EURUSD moved 35 pips on US BLS Producer Price Index (PPI) data on 11 April 2024.

USDJPY (19 pips)

EURUSD (16 pips)

Charts are exported from JForex (Dukascopy).


Unpacking the March 2024 Producer Price Index: A Subtle Shift in Economic Trends

In March 2024, the Producer Price Index (PPI) for final demand demonstrated a modest increase of 0.2 percent, seasonally adjusted, according to the latest report from the U.S. Bureau of Labor Statistics. This subtle uptick follows more significant rises in previous months—0.6 percent in February and 0.4 percent in January. Notably, this marked a slight cooling in the pace of price increases faced by producers in the United States. Here’s a deeper dive into the nuances of the March 2024 PPI report and what these figures could signify for the broader economy.

Overview of March 2024 PPI Increases

Over the past year, the unadjusted final demand index has grown by 2.1 percent, the largest 12-month advance since a 2.3 percent increase recorded in April 2023. This year-on-year growth is primarily driven by a 0.3 percent rise in prices for final demand services, contrasting with a slight decline of 0.1 percent in the index for final demand goods.

Detailed Insights:

  • Services Sector: The increase in services was broad-based, with significant contributions from sectors like securities brokerage, dealing, investment advice, and related services, which surged by 3.1 percent. This was balanced by a notable decline in traveler accommodation services, which dropped by 3.8 percent.

  • Goods Sector: The decline in goods was led by a 1.6 percent decrease in final demand energy prices, emphasizing the volatile nature of this category. On a positive note, prices for final demand foods rose by 0.8 percent, showing some sectors still face upward pricing pressures.

Core Inflation Measures

Stripping out the often volatile prices of food, energy, and trade services, the core PPI (final demand less foods, energy, and trade services) moved up by 0.2 percent in March, mirroring the general trend of modest inflation in more stable categories. This core measure has risen by 2.8 percent over the past 12 months, indicating a relatively steady inflationary environment in the core sectors of the economy.

Intermediate Demand Dynamics

The report also sheds light on intermediate demand, which tracks prices for goods, services, and construction products sold for resale, export, or as inputs to other products. In March, prices for processed goods for intermediate demand fell by 0.5 percent, largely due to a 1.5 percent drop in processed energy goods. This reflects broader declines in energy costs that could influence future final demand prices.

Conversely, prices for services for intermediate demand ticked up by 0.2 percent, supported by increases in sectors such as investment banking and metals wholesaling. These increases are important indicators of cost pressures within the service sector that could trickle down to consumer prices.

Implications for Business and Policy

For businesses, the fluctuating PPI indicates a mixed bag of cost pressures that could affect profit margins and pricing strategies. The rise in services costs, particularly in financial services, might lead to higher operational expenses, whereas the drop in goods prices, especially energy, could provide some relief.

From a policy perspective, the Federal Reserve and other policymakers will likely scrutinize these figures to assess inflationary trends and adjust monetary policy accordingly. The core PPI's steady rise suggests that underlying inflation pressures remain manageable, which could influence interest rate decisions in upcoming meetings.

Conclusion

The March 2024 PPI report highlights a complex economic landscape with divergent trends in goods and services. As we move further into 2024, businesses and policymakers must remain vigilant and adaptable to these evolving economic indicators. By understanding these trends, stakeholders can better navigate the uncertainties and opportunities that lie ahead in the dynamic U.S. economy.

Source: https://www.bls.gov/news.release/ppi.nr0.htm


Start futures forex fx news trading with Haawks G4A low latency machine-readable data, one of the fastest machine-readable news trading feed for US economic and commodity data.

Please let us know your feedback. If you are interested in timestamps, please send us an email to sales@haawks.com.

Comment

Share

Comment

Share

57 pips potential profit in 46 seconds on 10 April 2024, analysis on futures forex fx low latency news trading USDJPY and EURUSD on US BLS CPI (Consumer Price Index) data

According to our analysis USDJPY and EURUSD moved 57 pips on US BLS CPI (Consumer Price Index) data on 10 April 2024.

USDJPY (25 pips)

EURUSD (32 pips)

Charts are exported from JForex (Dukascopy).


March 2024 Consumer Price Index Summary

The latest report from the U.S. Bureau of Labor Statistics on the Consumer Price Index (CPI) for March 2024 sheds light on current economic conditions, indicating both continuity and change in the inflation landscape. As consumers and analysts alike scrutinize these figures, it's crucial to unpack the nuances of the data to understand its implications for the economy, businesses, and everyday Americans.

CPI Overview for March 2024

In March 2024, the CPI for All Urban Consumers (CPI-U) experienced a 0.4 percent increase on a seasonally adjusted basis, mirroring the rise observed in February. Looking at the bigger picture, the all items index escalated by 3.5 percent over the last 12 months before seasonal adjustment, marking a notable trend in inflationary pressures.

The primary drivers of the monthly inflation increase were the shelter and gasoline indexes, which collectively contributed to more than half of the overall rise in the index for all items. Specifically, the energy index saw a 1.1 percent uplift, while food prices edged up by 0.1 percent. Notably, the food at home index remained stagnant, but the food away from home index climbed by 0.3 percent.

Key Components and Sectoral Impacts

  • Shelter and Energy: The shelter index continued its upward trajectory, alongside a significant 1.1 percent increase in the energy index. Gasoline prices, in particular, rose by 1.7 percent, reflecting broader energy market trends.

  • Food Index: The marginal 0.1 percent rise in the food index, coupled with a stable food at home index, suggests moderate food price inflation. However, the food away from home index's 0.3 percent increase points to costlier dining out experiences.

  • Core Inflation: Excluding food and energy, the core CPI rose by 0.4 percent for the third consecutive month. This consistent growth in core inflation underscores persistent inflationary pressures beyond volatile food and energy prices.

Yearly Inflation Trends

The 12-month overview reveals a 3.5 percent rise in the all items index, accelerating from the 3.2 percent increase ending February. Core inflation, excluding food and energy, climbed by 3.8 percent over the past year, indicating sustained inflationary pressure. Energy and food indexes rose by 2.1 percent and 2.2 percent, respectively, highlighting varied inflation dynamics across sectors.

Looking Ahead

The CPI data for March 2024 illustrates ongoing inflationary pressures within the U.S. economy, with significant contributions from shelter, energy, and certain food categories. While some sectors like used cars and trucks saw price decreases, the general trend indicates that inflation remains a concern.

For consumers, this means budgeting for higher costs in housing, energy, and dining out. Businesses, particularly in the energy, food service, and insurance sectors, will need to navigate these inflationary pressures carefully, balancing cost increases with consumer affordability.

As we move forward, monitoring these trends will be crucial for policymakers, businesses, and consumers alike to make informed decisions in an evolving economic landscape. The next CPI report, scheduled for release in May 2024, will be eagerly anticipated for further insights into inflationary trends and their potential implications.

Source: https://www.bls.gov/news.release/cpi.nr0.htm


Start futures forex fx news trading with Haawks G4A low latency machine-readable data, one of the fastest machine-readable news trading feed for US economic and commodity data.

Please let us know your feedback. If you are interested in timestamps, please send us an email to sales@haawks.com.

Comment

Share

Comment

Share

12 pips potential profit in 15 seconds on 21 March 2024, analysis on futures forex fx low latency news trading USDJPY and EURUSD on US Jobless Claims and US Philadelphia Fed Manufacturing data

According to our analysis USDJPY and EURUSD moved 12 pips on US Jobless Claims and US Philadelphia Federal Reserve Bank Manufacturing Business Outlook Survey data on 21 March 2024.

USDJPY (9 pips)

EURUSD (3 pips)

Charts are exported from JForex (Dukascopy).


Unpacking the March 2024 Manufacturing Business Outlook Survey Insights

The latest Manufacturing Business Outlook Survey, with responses gathered between March 11 and March 18, 2024, offers a nuanced view of the manufacturing sector's current health and its prospects. The survey, a bellwether for manufacturing trends, presents a mix of cautious optimism and areas of concern, reflecting the complex dynamics influencing the sector. Let’s delve into the key takeaways and what they mean for the industry moving forward.

Modest Growth Amidst Challenges

The survey underscores a continued expansion in manufacturing activity, albeit at a pace that suggests caution among industry players. The general activity index, a key measure of manufacturing health, recorded a slight dip to 3.2 in March, marking its second consecutive positive reading but highlighting a tempered outlook among firms. This modest growth is further evidenced by the positive turn in new orders, with the index rising to 5.4, and a slight uptick in shipments.

However, not all indicators are positive. The employment index remained in negative territory at -9.6, suggesting ongoing challenges in workforce dynamics. Moreover, both price indexes for inputs and outputs have decreased, remaining below long-run averages, pointing to a complex pricing environment faced by manufacturers.

Current Indicators and Future Outlook

While current indicators reflect a mixed bag of modest growth and persisting challenges, the future outlook provides a brighter picture. The future general activity index leapt to 38.6, the highest since July 2021, indicating stronger expectations for growth in the coming months. This optimism is echoed in the significant increases in future new orders and shipments indexes, suggesting that firms are anticipating a rebound in demand.

Furthermore, the survey’s special questions reveal insights into production growth and capacity utilization, with a higher share of firms reporting an increase in production for the first quarter of 2024 compared to the last quarter of 2023. The median current capacity utilization rate remains stable, with most firms indicating slight to moderate constraints from labor supply but less concern from supply chains.

Implications for the Manufacturing Sector

The March 2024 survey paints a picture of a manufacturing sector at a crossroads. On one hand, the continued expansion and optimistic future expectations reflect the resilience and potential for growth within the industry. On the other, the challenges in employment and price pressures underscore the ongoing adjustments firms must navigate in a post-pandemic world.

For industry leaders, the key takeaway is the importance of strategic planning and flexibility. Investing in workforce development and technology can help mitigate employment challenges, while agile pricing strategies may address the volatile cost environment. Moreover, the positive future outlook suggests that firms should prepare for increased demand, making this an opportune time to review and enhance production capabilities.

Looking Ahead

As the manufacturing sector continues to navigate through a landscape marked by both opportunities and challenges, the insights from the March 2024 Manufacturing Business Outlook Survey offer valuable guidance. By understanding the current trends and future expectations, manufacturers can better position themselves for growth, adapting to the evolving market dynamics with resilience and strategic foresight.

Source: https://www.philadelphiafed.org/surveys-and-data/regional-economic-analysis/mbos-2024-03


Start futures forex fx news trading with Haawks G4A low latency machine-readable data, one of the fastest machine-readable news trading feeds for US economic and commodity data.

Please let us know your feedback. If you are interested in timestamps, please send us an email to sales@haawks.com.

Comment

Share

Comment

Share

20 pips potential profit in 19 seconds on 12 March 2024, analysis on futures forex fx low latency news trading USDJPY and EURUSD on US BLS CPI (Consumer Price Index) data

According to our analysis USDJPY and EURUSD moved 20 pips on US BLS CPI (Consumer Price Index) data on 12 March 2024.

USDJPY (12 pips)

EURUSD (8 pips)

Charts are exported from JForex (Dukascopy).


Understanding the February 2024 Consumer Price Index Report: A Deep Dive

The Consumer Price Index (CPI) for February 2024 was released by the U.S. Bureau of Labor Statistics (BLS), marking an essential gauge for economists, policymakers, and consumers to understand the current economic climate and inflation trends. The CPI measures the average change over time in the prices paid by urban consumers for a market basket of consumer goods and services. Let's dive into the details of the February 2024 report to unpack what it means for the economy and individuals.

February 2024 CPI Highlights

In February 2024, the Consumer Price Index for All Urban Consumers (CPI-U) saw a seasonally adjusted increase of 0.4 percent, following a 0.3 percent rise in January. This incremental change points to a persistent upward pressure on prices across a broad array of goods and services. Over the past 12 months, the all items index has risen by 3.2 percent before seasonal adjustment, indicating a slight acceleration in inflationary pressures.

Key Contributors to the February Increase

Several key components contributed to the February rise in the CPI-U:

  • Shelter and Gasoline: The indexes for shelter and gasoline saw significant increases in February, together accounting for over sixty percent of the monthly rise in the all items index. This combination of higher housing and fuel costs can strain household budgets.

  • Energy: The energy index increased by 2.3 percent, with all its component indexes also on the rise, adding to the overall inflationary pressure.

  • Food: Interestingly, the food index remained unchanged in February, with both the food at home and food away from home indexes showing little to no growth. This stability in food prices offers a slight reprieve amidst the broader inflationary trends.

Annual Perspective

Looking at the annual figures, the all items index increased by 3.2 percent over the 12 months ending February 2024, a notch above the 3.1 percent increase for the year ending in January. Notably, the energy index decreased by 1.9 percent over this period, providing a mixed picture of the inflationary landscape.

Analyzing the Numbers: What This Means for You

The February 2024 CPI report underscores ongoing inflationary pressures within the U.S. economy. For consumers, the rise in shelter and gasoline prices could lead to higher living expenses, affecting budgets and spending habits. On the flip side, the stabilization in food prices, albeit temporary, offers some relief.

For policymakers, the report's insights into inflationary trends are crucial for shaping monetary policy and interest rate decisions. The data presents a balancing act between stimulating economic growth and curbing inflation to maintain price stability.

Looking Ahead

As we move forward into 2024, all eyes will be on the evolving economic indicators and their implications for inflation, consumer spending, and monetary policy. The Consumer Price Index, as a primary measure of inflation, will continue to play a pivotal role in these discussions. The next CPI report, scheduled for release in April 2024, will be eagerly awaited for further clues on the direction of the U.S. economy.

In summary, the February 2024 CPI report highlights the nuanced landscape of inflationary pressures facing the U.S. economy. While certain sectors like energy and shelter are driving price increases, the overall picture is complex, with stabilizing food prices providing a counterbalance. Understanding these dynamics is essential for navigating the economic challenges and opportunities that lie ahead.

Source: https://www.bls.gov/news.release/cpi.nr0.htm


Start futures forex fx news trading with Haawks G4A low latency machine-readable data, one of the fastest machine-readable news trading feed for US economic and commodity data.

Please let us know your feedback. If you are interested in timestamps, please send us an email to sales@haawks.com.

Comment

Share

Comment

Share

24 pips potential profit in 3 minutes on 8 February 2024, analysis on futures forex fx low latency news trading USDJPY and EURUSD on US Jobless Claims data

According to our analysis USDJPY and EURUSD moved 24 pips on US Jobless Claims data on 8 February 2024.

USDJPY (19 pips)

EURUSD (5 pips)

Charts are exported from JForex (Dukascopy).


The latest report on unemployment insurance weekly claims, released on February 8, 2024, indicates a decrease in the number of initial jobless claims and a slight improvement in the U.S. labor market conditions. For the week ending February 3, the seasonally adjusted initial claims fell by 9,000 to 218,000 from the previous week's revised level. The 4-week moving average, which smooths out weekly volatility, increased slightly to 212,250. The seasonally adjusted insured unemployment rate decreased to 1.2% for the week ending January 27, with a corresponding decline in the number of people receiving unemployment benefits to 1,871,000.

Unadjusted data also showed a decline in initial claims, totaling 232,727, which is an 11.8% decrease from the previous week. The unadjusted insured unemployment rate stood at 1.4%, with a year-over-year comparison indicating a stable labor market. Regionally, the highest unemployment rates were in New Jersey, Rhode Island, and Minnesota, among others, with notable increases in initial claims in Oregon, California, and New York, and significant decreases in Illinois, Missouri, and Massachusetts.

This report suggests a resilient labor market, with fluctuations in unemployment claims reflecting normal economic adjustments rather than a significant downturn.

Source: https://www.dol.gov/ui/data.pdf


Start futures forex fx news trading with Haawks G4A low latency machine-readable data, one of the fastest machine-readable news trading feeds for US economic and commodity data.

Please let us know your feedback. If you are interested in timestamps, please send us an email to sales@haawks.com.

Comment

Share

Comment

Share

17 pips potential profit in 8 seconds on 1 February 2024, analysis on futures forex fx low latency news trading USDJPY and EURUSD on US Jobless Claims data

According to our analysis USDJPY and EURUSD moved 17 pips on US Jobless Claims data on 1 February 2024.

USDJPY (13 pips)

EURUSD (4 pips)

Charts are exported from JForex (Dukascopy).


The latest unemployment insurance weekly claims report provides detailed statistics on initial and continued claims for unemployment benefits in the United States for the week ending January 27, 2024. Here's a summary of the key points:

Seasonally Adjusted Data

  • Initial Claims: The seasonally adjusted initial claims for the week ending January 27 were 224,000, marking an increase of 9,000 from the previous week's revised level of 215,000.

  • 4-Week Moving Average: The moving average of initial claims rose by 5,250 to 207,750.

  • Insured Unemployment Rate: For the week ending January 20, the insured unemployment rate increased slightly to 1.3 percent, up by 0.1 percentage points.

  • Insured Unemployment Numbers: Seasonally adjusted insured unemployment during the week ending January 20 was 1,898,000, up by 70,000 from the previous week's revised level.

Unadjusted Data

  • Initial Unadjusted Claims: The advance number of unadjusted initial claims was 261,029 for the week ending January 27, an increase of 11,082 (or 4.4 percent) from the previous week.

  • Unadjusted Insured Unemployment Rate: The unadjusted insured unemployment rate was 1.5 percent during the week ending January 20, up by 0.1 percentage point.

  • Unadjusted Insured Unemployment Levels: There were 2,187,036 individuals claiming unemployment insurance in state programs, an increase of 133,750 (or 6.5 percent) from the previous week.

Additional Insights

  • Total Continued Weeks Claimed: For the week ending January 13, there were 2,080,990 continued weeks claimed in all programs, a decrease from the previous week.

  • Initial Claims by Federal Employees and Veterans: There was a decrease in initial claims filed by former Federal civilian employees and newly discharged veterans.

  • States with the Highest Insured Unemployment Rates: New Jersey and Rhode Island had the highest insured unemployment rates at 2.6 percent.

  • States with Notable Changes in Initial Claims: Wisconsin and Washington saw the largest increases in initial claims, while Texas, California, New York, Georgia, and Oregon experienced significant decreases.

This report indicates fluctuations in the job market, with an overall increase in both initial and continued claims for unemployment benefits, suggesting changes in the employment landscape.

Source: https://www.dol.gov/ui/data.pdf


Start futures forex fx news trading with Haawks G4A low latency machine-readable data, one of the fastest machine-readable news trading feeds for US economic and commodity data.

Please let us know your feedback. If you are interested in timestamps, please send us an email to sales@haawks.com.

Comment

Share

Comment

Share

29 pips potential profit in 7 seconds on 7 December 2023, analysis on futures forex fx low latency news trading USDJPY and EURUSD on US Jobless Claims data

According to our analysis USDJPY and EURUSD moved 29 pips on US Jobless Claims data on 7 December 2023.

USDJPY (19 pips)

EURUSD (10 pips)

Charts are exported from JForex (Dukascopy).


The latest release on Unemployment Insurance Weekly Claims in the United States for the week ending December 2, 2023, indicates a slight increase in seasonally adjusted initial claims by 1,000, reaching 220,000. The 4-week moving average rose to 220,750. The insured unemployment rate decreased to 1.2%. Unadjusted data saw an increase in actual initial claims to 293,511, up 46.9% from the previous week. The unadjusted insured unemployment rate rose to 1.2%, and continued weeks claimed for benefits in all programs decreased to 1,579,159.

Noteworthy state-specific data reveals the highest insured unemployment rates in New Jersey, Alaska, California, Hawaii, Puerto Rico, Massachusetts, New York, Oregon, Rhode Island, Pennsylvania, and Washington. Wisconsin experienced the largest increase in initial claims, while California saw the most significant decrease.

Federal civilian employees and newly discharged veterans claimed fewer benefits, with a decrease in both initial and continued weeks claimed. Overall, the report provides a comprehensive overview of unemployment trends at both national and state levels, including insights into specific demographic groups.

Source: https://www.dol.gov/ui/data.pdf


Start futures forex fx news trading with Haawks G4A low latency machine-readable data, one of the fastest machine-readable news trading feeds for US economic and commodity data.

Please let us know your feedback. If you are interested in timestamps, please send us an email to sales@haawks.com.

Comment

Share

Comment

Share

17 pips potential profit in 42 seconds on 16 November 2023, analysis on futures forex fx low latency news trading USDJPY and EURUSD on US Jobless Claims data

According to our analysis USDJPY and EURUSD moved 17 pips on US Jobless Claims data on 16 November 2023.

USDJPY (12 pips)

EURUSD (5 pips)

Charts are exported from JForex (Dukascopy).


In the week ending November 11, 2023, the United States saw a rise in both seasonally adjusted and unadjusted initial unemployment claims. The seasonally adjusted figure reached 231,000, reflecting a notable increase of 13,000 from the previous week, with a 4-week moving average of 220,250. The unadjusted data reported 215,874 actual initial claims, marking a week-to-week increase of 0.8 percent. Despite seasonal expectations for a decrease, the figures demonstrate a rise.

The insured unemployment rate also showed an increase, reaching 1.3 percent, a 0.1 percentage point uptick from the previous week. The number of insured unemployed individuals rose to 1,865,000, marking the highest level since November 27, 2021. The unadjusted insured unemployment rate remained at 1.1 percent, with 1,581,345 individuals claiming benefits, a decrease of 1.6 percent from the preceding week.

Source: https://www.dol.gov/ui/data.pdf


Start futures forex fx news trading with Haawks G4A low latency machine-readable data, one of the fastest machine-readable news trading feeds for US economic and commodity data.

Please let us know your feedback. If you are interested in timestamps, please send us an email to sales@haawks.com.

Comment

Share

Comment

Share

58 pips and 222 points potential profit in 444 seconds on 14 November 2023, analysis on futures forex fx low latency news trading EURUSD, USDJPY and US30 on US BLS Consumer Price Index (CPI) data

According to our analysis EURUSD and USDJPY moved 58 pips and US30 moved 222 points on US BLS CPI (Consumer Price Index) data on 14 November 2023.

EURUSD (38 pips)

USDJPY (20 pips)

US30 (222 points)

Charts are exported from JForex (Dukascopy).


The Consumer Price Index for All Urban Consumers (CPI-U) remained unchanged in October, following a 0.4 percent increase in September. Over the last 12 months, the all items index increased by 3.2 percent before seasonal adjustment.

Components:

  • Shelter: The index for shelter continued its upward trend, compensating for a decline in the gasoline index, resulting in a stable seasonally adjusted index for the month.

  • Energy: The energy index fell by 2.5 percent in October, largely due to a significant decline in the gasoline index. The energy index decreased by 4.5 percent over the last 12 months.

  • Food: The food index increased by 0.3 percent, with the index for food at home rising by 0.3 percent and food away from home rising by 0.4 percent.

  • All Items Less Food and Energy: This index rose by 0.2 percent in October, driven by notable increases in rent, owners' equivalent rent, motor vehicle insurance, medical care, recreation, and personal care.

Inflation Rates:

  • All Items: The all items index rose by 3.2 percent for the 12 months ending October, a smaller increase than the 3.7-percent rise for the 12 months ending September.

  • All Items Less Food and Energy: This index rose by 4.0 percent over the last 12 months, its smallest 12-month change since September 2021.

  • Energy: The energy index decreased by 4.5 percent for the 12 months ending October.

Selected Categories:

  • Food at Home: The index rose by 2.1 percent over the last 12 months.

  • Food Away From Home: The index rose by 5.4 percent over the last year.

  • Energy Commodities: Notable decline of 6.2 percent over the last 12 months.

  • New Vehicles: An increase of 1.9 percent.

  • Used Cars and Trucks: A decrease of 7.1 percent.

Notable Changes:

  • Shelter: The shelter index played a significant role in the monthly increase in the index for all items less food and energy.

  • Medical Care: The medical care index rose by 0.3 percent in October, with increases in hospital services and prescription drugs.

  • Transportation Services: Experienced an increase of 9.2 percent over the month.

Market Reaction: In response to this CPI data, the financial markets exhibited specific movements:

  • EURUSD: Demonstrated an upward movement of 38 pips, reflecting a stronger Euro against the US Dollar.

  • USDJPY: Experienced a downward movement of 20 pips, indicating a weaker US Dollar against the Japanese Yen.

  • US30 (Dow Jones): Showed an upward movement of 222 points, suggesting positive sentiment in the stock market.

Outlook: The all items index rose by 3.2 percent over the last 12 months. The next CPI for November 2023 is scheduled to be released on December 12, 2023.

This comprehensive overview combines CPI data, market reactions, and potential economic implications, providing a well-rounded understanding of the economic landscape in October 2023.

Source: https://www.bls.gov/news.release/cpi.nr0.htm


Start futures forex fx news trading with Haawks G4A low latency machine-readable data, one of the fastest machine-readable news trading feeds for US macro-economic and commodity data.

Please let us know your feedback. If you are interested in timestamps, please send us an email to sales@haawks.com.

Comment

Share