Viewing entries in
Forex News Trading

Comment

19 ticks potential profit in 17 seconds on 15 May 2025, analysis on futures news trading natural gas on DOE Natural Gas Storage Report data

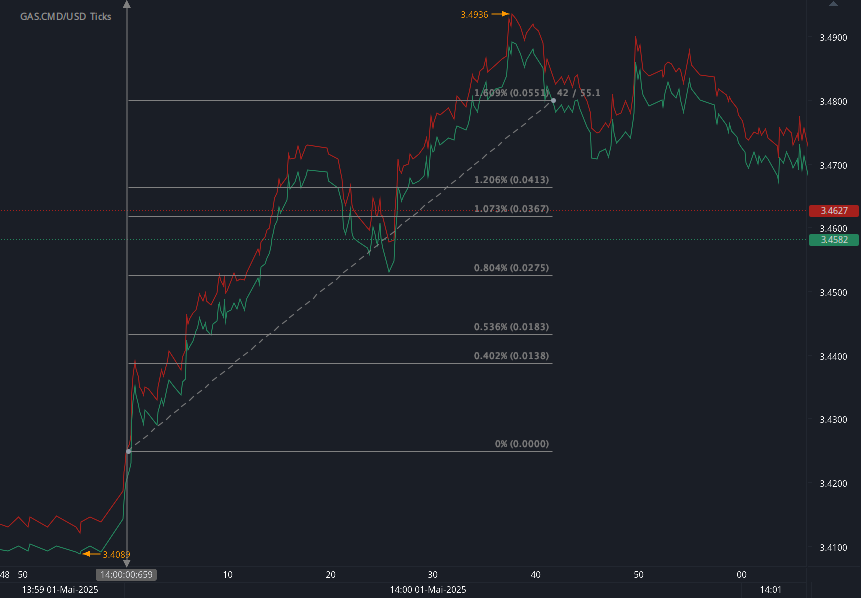
According to our analysis natural gas moved 17 ticks on DOE Natural Gas Storage Report data on 15 May 2025.

Natural gas (19 ticks)

Charts are exported from JForex (Dukascopy).


U.S. Natural Gas Storage Sees Strong Build Amid Seasonal Demand Shifts

Published: May 16, 2025

The latest report from the U.S. Energy Information Administration (EIA) reveals a significant weekly injection into underground natural gas storage, marking an important trend as the industry transitions from the heating season toward summer cooling demand.

Key Highlights

  • Total U.S. working gas in storage: 2,255 billion cubic feet (Bcf)

  • Weekly change: +110 Bcf

  • Compared to one year ago: 375 Bcf lower

  • Compared to five-year average (2020–2024): 57 Bcf higher

This 110 Bcf net injection reflects robust storage activity, exceeding typical mid-May seasonal expectations. Despite being significantly below last year’s levels, total inventories are now 2.6% above the five-year average, providing some cushion ahead of the peak summer demand season.

What This Means for the Market

Natural gas prices may remain relatively stable or even soften in the short term due to this above-average injection and healthy storage buffer. However, the year-over-year deficit—particularly in major demand regions like the East and Midwest—could become a concern if summer heat drives stronger cooling-related demand or if supply disruptions occur.

The market will also be closely watching for shifts in LNG export volumes, production growth from shale regions, and any early-season heat waves, all of which could influence injection rates in the coming months.

A Closer Look at Historical Context

  • Year-Ago Storage (May 9, 2024): 2,630 Bcf

  • Five-Year Average: 2,198 Bcf

  • Current Storage: 2,255 Bcf

Despite being well below last year’s unusually high levels, current stocks remain comfortably within the historical range, as noted in the EIA's shaded graph data.

Final Thoughts

As we progress further into the 2025 injection season, the pace of storage builds and demand pressures from the power generation sector will be critical indicators for summer gas market dynamics. This week’s data suggests solid fundamentals, but with a lingering note of caution due to year-over-year deficits.

Stay tuned for the next release on May 22, 2025, which will offer further insights into how the storage trend is shaping up ahead of the high-demand summer period.

Disclaimer: This blog post is for informational purposes only and should not be construed as financial advice. Always conduct thorough research and consider seeking advice from a financial professional before making any investment decisions.

Source: https://ir.eia.gov/ngs/ngs.html


Start futures forex fx commodity news trading with Haawks G4A low latency machine-readable data, one of the fastest data feeds for DOE data.

Please let us know your feedback. If you are interested in timestamps, please send us an email to sales@haawks.com.

Comment

Comment

17 pips and US500 10 points potential profit in 248 seconds on 15 May 2025, analysis on futures forex fx low latency news trading USDJPY and US500 on US BLS Producer Price Index (PPI) data

According to our analysis USDJPY moved 17 pips and US 500 moved 10 points on US BLS Producer Price Index (PPI), US Retail Sales, US Jobless Claims and Philly Fed Manufacturing data on 15 May 2025.

USDJPY (17 pips)

US500 (10 points)

Charts are exported from JForex (Dukascopy).


Inflation Cools While Consumers Keep Spending: A Look at April 2025’s Economic Pulse

May 16, 2025 | By Economic Insights Blog Team

The economic landscape this spring reveals a nuanced picture: while inflation pressures at the production level are softening, consumer demand remains resilient. Let’s break down the key takeaways from the latest government data on producer prices, retail sales, unemployment claims, and manufacturing activity.

Producer Price Index (PPI): April Brings a Rare Drop

According to the Bureau of Labor Statistics, the Producer Price Index (PPI) for final demand fell 0.5% in April, a sharp contrast to March’s flat reading. This is the largest drop since October 2023.

  • Services led the decline, dropping 0.7%, primarily due to falling trade margins — notably in machinery and vehicle wholesaling, which saw a steep 6.1% fall.

  • Final demand goods prices were flat overall. However:

    • Core goods (excluding food and energy) rose 0.4%.

    • Food prices dropped 1.0%, while energy prices dipped 0.4%.

    • Chicken eggs saw a dramatic 39.4% plunge.

12-month change: Final demand prices are still up 2.4% annually, suggesting inflation is moderating but not gone. Core PPI (less food, energy, and trade) rose 2.9% year-over-year.

Retail Sales: Consumers Show Modest Growth

The Census Bureau reports that retail and food services sales in April grew by 0.1%, following an upward revision to 1.7% growth in March. While modest, this marks 5.2% year-over-year growth — a sign that consumers are still opening their wallets.

  • Retail trade edged down 0.1%, but:

    • Motor vehicle & parts dealers surged 9.4% over last year.

    • Food services and drinking places rose 7.8% year-over-year, showing strength in discretionary spending.

Unemployment Claims: Steady, but Slight Uptick in Trend

Unemployment insurance claims held steady:

  • Initial claims: 229,000 (unchanged from prior week).

  • 4-week moving average: 230,500 (slight rise).

  • Insured unemployment rate: 1.2% — unchanged, signaling labor market stability.

Notably:

  • Michigan saw a spike in initial claims (+6,869), mostly from manufacturing layoffs.

  • New York saw a large drop (-15,228), thanks to fewer layoffs across education, transport, food services, and government.

Philadelphia Fed Manufacturing Survey: Weak But Hopeful

The Philadelphia Fed’s May Manufacturing Business Outlook Survey shows that current activity remains weak, but optimism is rising:

  • General activity index: Improved to -4.0 from -26.4, still negative but recovering.

  • New orders jumped into positive territory at 7.5, while shipments dropped further to -13.0.

  • Employment index rose significantly to 16.5, and workweek hours ticked up.

  • Price pressures remain strong: Prices paid surged to 59.8, and prices received rose to 43.6 — both the highest since June 2022.

Future outlook? Brightening:

  • Future general activity index spiked to 47.2, with new orders and shipments also showing strong expected growth.

  • Businesses now expect 3.8% inflation for consumers and are preparing for higher compensation costs and competitive price increases in the near term.

What It All Means

The April data gives mixed but mostly encouraging signals:

  • Disinflation is real at the producer level, particularly in services and food.

  • Consumers are still spending, albeit more cautiously than earlier in the year.

  • Labor markets are steady, even amid isolated layoffs.

  • Manufacturers are hopeful, though current conditions remain sluggish.

Bottom Line: The U.S. economy in April 2025 is treading a fine line — inflation is cooling without crushing consumer demand or jobs. But manufacturers and retailers are watching input costs and pricing power carefully. The months ahead will test whether this delicate balance holds.

Next Key Releases to Watch:

  • May PPI: June 12

  • May Jobs Report: June 6

  • FOMC Meeting: June 18–19

Stay tuned for deeper dives and analysis right here at Economic Insights.

Disclaimer: This blog post is for informational purposes only and should not be construed as financial advice. Always conduct thorough research and consider seeking advice from a financial professional before making any investment decisions.

Source: https://www.bls.gov/news.release/ppi.nr0.htm, https://www.census.gov/retail/sales.html, https://www.dol.gov/ui/data.pdf, https://www.philadelphiafed.org/-/media/FRBP/Assets/Surveys-And-Data/MBOS/2025/bos0525.pdf


Start futures forex fx news trading with Haawks G4A low latency machine-readable data, one of the fastest machine-readable news trading feed for US economic and commodity data.

Please let us know your feedback. If you are interested in timestamps, please send us an email to sales@haawks.com.

Comment

Comment

3 pips and US500 14 points potential profit in 23 seconds on 13 May 2025, analysis on futures forex fx low latency news trading USDJPY and US500 on US Consumer Price Index (CPI)

According to our analysis USDJPY moved 3 pips and US500 moved 14 points on US BLS Consumer Price Index (CPI) data on 13 May 2025.

USDJPY (3 pips)

US500 (14 points)

Charts are exported from JForex (Dukascopy).


April 2025 CPI Report: Inflation Slows, Shelter and Energy Drive Modest Gains

The U.S. Bureau of Labor Statistics (BLS) released the Consumer Price Index (CPI) data for April 2025, offering a mixed picture of inflation trends across the economy. Overall, consumer prices rose 0.2% in April on a seasonally adjusted basis after a slight decline in March. Year-over-year, prices are up 2.3% before seasonal adjustment, marking the smallest annual increase since February 2021.

Key Highlights:

  • Overall Inflation: +0.2% month-over-month in April; +2.3% year-over-year.

  • Core Inflation (excluding food and energy): +0.2% in April; +2.8% over the past 12 months.

  • Food Prices: Declined by 0.1% in April, driven by a sharp 0.4% drop in the food at home index.

  • Energy Prices: Rose 0.7% in April but are still down 3.7% compared to a year ago.

Shelter Continues to Lead

The shelter index increased by 0.3% in April, accounting for more than half of the overall rise in CPI. On an annual basis, shelter costs have risen 4.0%, making it a significant contributor to persistent core inflation. Rents and owners' equivalent rent both increased 0.3% and 0.4% respectively in April.

Energy Prices Rebound Slightly

While energy prices rose in April, the rebound was modest. Natural gas saw a notable 3.7% increase, and electricity rose 0.8%. However, gasoline prices dipped slightly by 0.1% (though they rose 2.9% before seasonal adjustment). Over the last 12 months, gasoline prices have dropped 11.8%, and fuel oil is down 9.6%.

Food Prices Show Mixed Trends

Food at home prices dropped 0.4%, the largest monthly decline since September 2020. The sharpest decline was seen in eggs, down 12.7% in April. Most major grocery categories posted declines, while nonalcoholic beverages were up 0.7%. In contrast, the food away from home index rose 0.4%, driven by increases in full-service (+0.6%) and limited-service meals (+0.3%).

Over the past year, food prices have risen 2.8%, with food away from home up 3.9% and food at home up 2.0%. Notably, egg prices have surged 49.3% year-over-year despite the April drop.

Core Categories Show Mixed Movement

Beyond food and energy, prices for household furnishings and operations increased 1.0%, and motor vehicle insurance rose 0.6%. Medical care rose 0.5%, with increases in hospital services (+0.6%) and prescription drugs (+0.4%).

Some categories saw declines, including airline fares (-2.8%), used cars and trucks (-0.5%), communication, and apparel (-0.2%). New vehicle prices remained unchanged.

A Shift in Methodology

April 2025 also marked a methodological update for the CPI. The BLS has transitioned to using transaction data purchased from a vendor to calculate the leased cars and trucks index, aiming to improve accuracy.

Looking Ahead

The next CPI release, covering May 2025, is scheduled for Wednesday, June 11, 2025. It will offer further insights into whether inflation continues to moderate and how evolving economic conditions impact consumer prices.

Disclaimer: This blog post is for informational purposes only and should not be construed as financial advice. Always conduct thorough research and consider seeking advice from a financial professional before making any investment decisions.

Source: https://www.bls.gov/news.release/cpi.nr0.htm


Start futures forex fx news trading with Haawks G4A low latency machine-readable data, one of the fastest machine-readable news trading feed for US macro-economic and commodity data.

Please let us know your feedback. If you are interested in timestamps, please send us an email to sales@haawks.com.

Comment

Comment

9 pips and US500 3 points potential profit in 133 seconds on 8 May 2025, analysis on futures forex fx news trading USDJPY and US500 on US Jobless Claims data

According to our analysis USDJPY moved 9 pips and US500 moved 3 points on US Jobless Claims data on 8 May 2025.

USDJPY (9 pips)

US500 (3 points)

Charts are exported from JForex (Dukascopy).


U.S. Weekly Jobless Claims Drop as Labor Market Remains Resilient

Published: May 8, 2025

The U.S. labor market showed signs of stability this week as initial unemployment insurance (UI) claims decreased, according to the latest data released by the Department of Labor. For the week ending May 3, seasonally adjusted initial claims for unemployment benefits fell to 228,000, down by 13,000 from the previous week’s unrevised figure of 241,000.

Key Takeaways:

  • Initial claims (seasonally adjusted): 228,000 (↓13,000 from prior week)

  • 4-week moving average: 227,000 (↑1,000 from previous week)

  • Insured unemployment rate (seasonally adjusted): 1.2% (↓0.1%)

  • Insured unemployment level: 1,879,000 (↓29,000 from the prior week)

Despite a small uptick in the four-week moving average for initial claims, the overall decline in weekly claims suggests that layoffs remain relatively contained.

Unadjusted Numbers Highlight Broader Declines

Unadjusted data showed an even more pronounced drop. The number of actual initial claims under state programs fell to 206,937, a decline of 16,972 claims, or 7.6%, from the previous week. This was notably more than the expected seasonal decrease of just 4,584 claims.

When compared to the same period last year, initial claims are slightly below the 210,050 reported in early May 2024, indicating that the labor market remains historically tight.

Continued Claims Edge Lower

Continued claims, which reflect the number of people receiving ongoing benefits, also saw a decrease. For the week ending April 26:

  • Seasonally adjusted insured unemployment fell to 1,879,000 (↓29,000).

  • The four-week moving average rose slightly to 1,874,500.

  • The unadjusted insured unemployment rate held steady at 1.2%.

State-Level Insights

Some states saw significant changes in initial claims:

  • Increases:

    • New York: +15,418 (layoffs in transportation, accommodation, food services, education, and public administration)

    • Massachusetts: +3,301 (education sector)

    • Georgia: +1,207

    • Puerto Rico: +1,012

  • Decreases:

    • Connecticut: -2,340

    • Rhode Island: -1,850

    • Missouri: -1,696

    • Michigan: -1,436

The largest insured unemployment rates were seen in New Jersey and Rhode Island (2.5%), followed by California (2.3%) and Washington (2.1%).

Federal Program Activity

Federal unemployment programs remained largely unchanged. Claims filed by former federal civilian employees totaled 468, while newly discharged veterans filed 339 initial claims. Continued weeks claimed by both groups showed minimal movement.

Conclusion

This week’s decline in initial and continued claims underscores the resilience of the U.S. labor market, even amid sector-specific layoffs. While certain states and industries are experiencing localized job losses, overall jobless claim levels remain consistent with a healthy employment environment.

As economic uncertainties persist, analysts will be watching these weekly claims numbers closely for early signs of a broader labor market shift.

Disclaimer: This blog post is for informational purposes only and should not be construed as financial advice. Always conduct thorough research and consider seeking advice from a financial professional before making any investment decisions.

Sources: https://www.dol.gov/ui/data.pdf


Please let us know your feedback. If you are interested in timestamps, please send us an email to sales@haawks.com.

Start futures forex fx news trading with Haawks G4A low latency machine-readable data today, one of the fastest news data feeds for US macro-economic and commodity data.

Comment

329 pips, US30 771 points and BTC 3908 points potential futures forex fx news trading profit from 11 events in the first quarter of 2025 with Haawks G4A machine-readable news data feed

Comment

329 pips, US30 771 points and BTC 3908 points potential futures forex fx news trading profit from 11 events in the first quarter of 2025 with Haawks G4A machine-readable news data feed

We are pleased to announce that there was a potential of 329 pips/ticks, US30 771 points and BTC 3908 points profit out of the following 11 events in the first quarter of 2025 based on our ex-post analysis. The potential performance for 2024 was 4,305 pips/ticks.

Q1 2025

Cumulative potential, indicative performance Q1 2025 (only pips), please see all releases below.

Total trading time would have been around 19 minutes in 3 months! (preparation time not included)

You can click on each release for detailed information.


Q1 2025 Market Wrap-Up: Key U.S. Economic Releases and Market Reactions

The first quarter of 2025 delivered a series of impactful U.S. economic data releases, with notable volatility across major markets including forex (USD), equities (US30), and crypto (BTC). Here's a concise breakdown of the most market-moving events:

  • Job Market Data:

    • Initial Jobless Claims on January 2 moved the USD by 28 pips, kicking off the year with a moderate reaction.

    • JOLTS Reports on January 7 and February 4 showed declining market impact, with moves shrinking from 25 pips to 15 pips, and a modest US30 reaction of 26 points in February.

    • The Non-Farm Payrolls (NFP) on January 10 had the biggest labor market impact, sparking a 35-pip USD move and a 210-point surge in the US30.

  • Inflation Data (CPI):

    • January 15 CPI data drove 25 pips, 90 points on the US30, and a notable 1018-point jump in BTC.

    • February 12 CPI repeated this market-moving trend with 23 pips, 147 US30 points, and a 1279-point BTC reaction, reinforcing inflation as a key driver for crypto and equity traders alike.

  • Consumer Sentiment:

    • The University of Michigan reports on February 7 and March 14 showed consistent market engagement. BTC and US30 responded significantly, with the March release pushing the US30 up 154 points and BTC up 592 points.

  • Agricultural and Commodity Reports:

    • The USDA WASDE and Grain Stocks release on January 10 triggered a massive 104-tick move, while the February 11 WASDE still saw solid market action at 40 ticks.

  • Retail Sales:

    • The February 14 report had a moderate impact, generating a 20-pip USD move and 280 points on BTC, suggesting strong trader attention to consumer spending data.

Overall, inflation and employment reports remained the dominant themes in Q1, with crypto markets—particularly BTC—reacting sharply to CPI data and sentiment indexes. Equities also showed sensitivity, especially to job and inflation metrics, while agricultural markets responded decisively to USDA data.

Here's a chart summarizing the market reactions across USD, US30, BTC, and commodity markets for key U.S. economic releases in Q1 2025.


Disclaimer: This blog post is for informational purposes only and should not be construed as financial advice. Always conduct thorough research and consider seeking advice from a financial professional before making any investment decisions.


Start futures/forex/oil/grains news trading with Haawks G4A low latency machine-readable data today, we offer one of the fastest machine-readable data feeds for US macro-economic and commodity data and macro-economic data from Norway, Sweden, Switzerland Turkey and ECB interest rates and statement.

Please let us know your feedback and check out our G4A low latency data feed.

All data is machine readable and available via API access in Chicago, New York and London. Free trials.

Comment

Comment

19 pips, US500 19 points and BTC 192 points potential profit in 92 seconds on 2 May 2025, analysis on forex fx futures news trading USDJPY, US500 and BTC on US Employment Situation (NFP) data

According to our analysis USDJPY, US500 and BTC moved 19 pips, 19 points and 192 points on US Employment Situation (Non-farm payrolls / NFP) data on 2 May 2025.

USDJPY (19 pips)

US500 (19 points)

BTC (192 points)

Charts are exported from JForex (Dukascopy).


April 2025 Jobs Report: Steady Growth with a Few Soft Spots

The U.S. labor market continued its slow but steady climb in April 2025, according to the latest data from the Bureau of Labor Statistics (BLS). Nonfarm payrolls increased by 177,000, a solid gain that’s slightly above the average monthly increase of 152,000 over the past year. Meanwhile, the unemployment rate held steady at 4.2%, continuing a nearly year-long trend of relative stability in joblessness.

Key Takeaways:

Job Growth Driven by Health Care and Transportation

  • Health care led the way with 51,000 new jobs, continuing its strong performance from previous months. Hospitals and ambulatory health care services were major contributors.

  • Transportation and warehousing added 29,000 jobs, with gains in warehousing and storage (+10,000), couriers and messengers (+8,000), and air transportation (+3,000).

Other Industries on the Rise

  • Financial activities added 14,000 jobs, bringing total gains since April 2024 to over 100,000.

  • Social assistance employment rose by 8,000, though at a slower pace than usual.

Federal Government Job Cuts

  • Federal employment fell by 9,000 jobs in April and is down 26,000 since January. This marks a continued contraction in the public sector.

Other Notable Stats:

  • The number of unemployed people remained at 7.2 million.

  • Long-term unemployment rose to 1.7 million, making up 23.5% of all unemployed persons.

  • The labor force participation rate stayed flat at 62.6%, and the employment-population ratio held at 60.0%.

  • Wages continue to grow modestly:

    • Average hourly earnings rose by 6 cents to $36.06, up 3.8% year-over-year.

    • Nonsupervisory workers saw a 10-cent gain to $31.06.

Revisions & Trends

The jobs numbers from February and March were revised down by a total of 58,000 jobs, tempering earlier optimism. While these revisions don't indicate a major downturn, they reflect the continued balancing act of a cooling economy with pockets of resilience.

Bottom Line:

April’s jobs report reflects a labor market that’s stable, but not booming. Most of the gains are concentrated in a few key sectors, while other areas — including government — are shedding jobs. Wage growth is modest, and the overall unemployment rate remains within a narrow range.

With the next employment report due June 6, attention will remain focused on whether this steady trajectory can be maintained amid ongoing economic uncertainties.

Disclaimer: This blog post is for informational purposes only and should not be construed as financial advice. Always conduct thorough research and consider seeking advice from a financial professional before making any investment decisions.

Source: https://www.bls.gov/news.release/empsit.nr0.htm


Start forex fx futures news trading with Haawks G4A low latency machine-readable data today, one of the fastest news data feeds for US macro-economic and commodity data.

Please let us know your feedback. If you are interested in timestamps, please send us an email to sales@haawks.com.

Comment

Comment

55 ticks potential profit in 42 seconds on 1 May 2025, analysis on futures news trading natural gas on DOE Natural Gas Storage Report data

According to our analysis natural gas moved 55 ticks on DOE Natural Gas Storage Report data on 1 May 2025.

Natural gas (55 ticks)

Charts are exported from JForex (Dukascopy).


Natural Gas Storage Inches Upward as Spring Builds Continue

May 2, 2025

The U.S. Energy Information Administration (EIA) released its latest Weekly Natural Gas Storage Report on May 1, 2025, revealing a notable build in underground natural gas stocks as the country transitions deeper into spring. For the week ending April 25, 2025, working gas in storage across the Lower 48 states rose by 107 billion cubic feet (Bcf), bringing total inventories to 2,041 Bcf.

This increase keeps gas storage slightly ahead of the five-year average of 2,036 Bcf and narrows the year-on-year deficit, although stocks still trail last year's levels by 435 Bcf, a decline of 17.6%.

Regional Storage Trends

Breaking it down by region:

  • East: Added 36 Bcf, reaching 331 Bcf—down 21.7% from last year.

  • Midwest: Increased by 29 Bcf to 425 Bcf, 24.4% lower than a year ago.

  • Mountain: Saw a modest build of 3 Bcf to 174 Bcf, only 3.9% off from 2024 levels.

  • Pacific: Added 5 Bcf to hit 226 Bcf, down 5.4% from last year but still 19.6% above the five-year average.

  • South Central: Gained 34 Bcf to reach 885 Bcf, with the Salt component up 15 Bcf and Nonsalt up 20 Bcf.

Despite the year-over-year deficit, this week's build puts national storage comfortably within the five-year historical range—an encouraging sign for market stability heading into the summer months.

A Closer Look at Variability

The EIA also provided sampling variability estimates. The total coefficient of variation for stocks was just 0.4%, suggesting high reliability in this week's numbers. Standard error for the net change was only ±1.0 Bcf, reinforcing confidence in the reported 107 Bcf injection.

Outlook

With injection season ramping up, attention turns to weather forecasts, LNG export trends, and domestic demand as key drivers of storage trajectories in the weeks ahead. If moderate builds like this week’s continue, the market could see a more balanced setup heading into the heating season later this year, despite the current shortfall relative to 2024.

Stay tuned for the next report on May 8, 2025, for updates on how U.S. storage levels are evolving.

Disclaimer: This blog post is for informational purposes only and should not be construed as financial advice. Always conduct thorough research and consider seeking advice from a financial professional before making any investment decisions.

Source: https://ir.eia.gov/ngs/ngs.html


Start futures forex fx commodity news trading with Haawks G4A low latency machine-readable data, one of the fastest data feeds for DOE data.

Please let us know your feedback. If you are interested in timestamps, please send us an email to sales@haawks.com.

Comment

Comment

29 pips and US500 7 points potential profit in 64 seconds on 1 May 2025, analysis on futures forex fx news trading USDJPY and US500 on US Jobless Claims data

According to our analysis USDJPY moved 29 pips and US500 moved 7 points on US Jobless Claims data on 1 May 2025.

USDJPY (29 pips)

US500 (7 points)

Charts are exported from JForex (Dukascopy).


Weekly Jobless Claims Rise Sharply to 241,000 – Is the Labor Market Cooling?

May 1, 2025 – U.S. Department of Labor Report Summary

This week's unemployment insurance claims report from the U.S. Department of Labor signals potential shifts in the U.S. labor market, as both initial claims and continuing claims for unemployment benefits rose sharply.

Key Highlights

  • Initial Claims Surge: For the week ending April 26, the seasonally adjusted number of initial claims for unemployment insurance rose to 241,000, an increase of 18,000 from the previous week's revised total of 223,000.

  • Highest Since August 2023: This marks one of the largest weekly increases in recent months and pushes the 4-week moving average up by 5,500 to 226,000.

  • Insured Unemployment Increases: The number of people continuing to receive unemployment benefits, known as insured unemployment, jumped by 83,000 to 1.916 million for the week ending April 19. This is the highest level since November 2021.

  • Insured Unemployment Rate Rises: The insured unemployment rate ticked up to 1.3%, reflecting more workers staying on unemployment benefits for longer.

State-Level Trends

Several states reported notable increases in new jobless claims:

  • New Jersey: +2,875 claims, driven by layoffs in the educational services sector.

  • Connecticut: +2,231 claims (no specific reason cited).

  • Rhode Island: +1,868 claims, impacted by job losses in transportation, hospitality, administration, and healthcare.

Meanwhile, other states saw sharp drops in claims:

  • Kentucky: -4,613 claims due to fewer layoffs in manufacturing.

  • Texas and Oklahoma: Claims fell by 1,896 and 1,336, respectively.

Long-Term Trends & Context

Compared to the same week in 2024:

  • Initial claims are up from 209,000 to 241,000.

  • Insured unemployment is also higher, rising from 1.771 million to 1.916 million.

  • The unadjusted insured unemployment rate has increased from 1.2% to 1.3%.

These shifts may suggest emerging softness in the labor market, particularly in service-oriented and seasonal industries. However, fluctuations in weekly claims data are common and can be influenced by temporary factors such as school breaks, business cycles, and hiring lulls.

Why It Matters

Initial claims are considered a leading indicator of labor market health, reflecting real-time business decisions around hiring and layoffs. A sustained increase over several weeks could point to a broader slowdown in hiring or rising job insecurity. Conversely, continued strength in other economic indicators (like job openings or wage growth) may buffer these effects.

What to Watch

  • Will the trend continue in the coming weeks, or is this a one-off spike?

  • How will the Federal Reserve interpret this data amid ongoing inflation and interest rate decisions?

  • Are certain industries or regions consistently showing signs of strain?

Bottom Line: While the labor market remains relatively strong by historical standards, this week's uptick in unemployment claims warrants attention. Policymakers, businesses, and job seekers alike will be watching closely to see if this marks the start of a new trend.

Disclaimer: This blog post is for informational purposes only and should not be construed as financial advice. Always conduct thorough research and consider seeking advice from a financial professional before making any investment decisions.

Sources: https://www.dol.gov/ui/data.pdf


Please let us know your feedback. If you are interested in timestamps, please send us an email to sales@haawks.com.

Start futures forex fx news trading with Haawks G4A low latency machine-readable data today, one of the fastest news data feeds for US macro-economic and commodity data.

Comment

Comment

US500 21 points and BTC 305 points potential profit in 180 seconds on 30 April 2025, analysis on futures forex fx low latency news trading US500 and BTC on US Gross Domestic Product (GDP) data

According to our analysis US500 moved 21 points and BTC moved 305 points on US Gross Domestic Product (GDP) data on 30 April 2025.

US500 (21 points)

BTC (305 points)

Charts are exported from JForex (Dukascopy).


U.S. Economy Contracts Slightly in Q1 2025 Amid Rising Imports and Government Spending Cuts

Posted April 30, 2025

The U.S. economy experienced a mild contraction in the first quarter of 2025, according to the advance estimate released today by the Bureau of Economic Analysis (BEA). Real Gross Domestic Product (GDP) decreased at an annual rate of 0.3 percent from January through March, a sharp reversal from the 2.4 percent growth posted in the final quarter of 2024.

This downturn was driven primarily by a surge in imports—especially in consumer goods such as pharmaceuticals and capital goods like computer hardware—and a decline in federal government spending, notably on defense. These negative contributions were only partly offset by gains in investment, consumer spending, and exports.

A Deeper Look at the Components

Consumer Spending:
Consumer activity remained a bright spot in the economy, increasing during the quarter. Services led the charge, particularly in health care and housing-related expenditures. On the goods side, spending on nondurable goods rose, though this was partially offset by a dip in durable goods purchases.

Investment:
Private inventory investment saw notable growth, largely due to increased inventory in wholesale trade—especially drugs and sundries. This uptick played a major role in mitigating the overall GDP decline.

Imports and Exports:
The increase in imports significantly outpaced export growth, dragging down GDP. While exports did rise, they were not enough to offset the negative impact of higher imports. Notably, the BEA made an adjustment to remove a spike in silver bar imports from investment calculations, as such metals are considered valuables rather than productive assets under GDP accounting rules.

Government Spending:
Federal government expenditures decreased sharply, led by cuts in defense spending. This was partially balanced by a rise in compensation at the state and local government level, but overall, public sector spending contributed negatively to GDP.

Inflation Pressures Mount

Inflation picked up across key indicators. The gross domestic purchases price index rose 3.4 percent in Q1, compared to 2.2 percent in Q4 2024. The Personal Consumption Expenditures (PCE) price index increased 3.6 percent, with the core PCE index—excluding food and energy—rising 3.5 percent. These figures point to growing inflationary pressure, potentially shaping future monetary policy decisions.

Underlying Strength in Private Demand

Despite the headline GDP contraction, underlying private demand remained strong. Real final sales to private domestic purchasers—which combines consumer spending and fixed investment—grew by 3.0 percent, slightly higher than the 2.9 percent gain in Q4. This suggests the domestic private sector remains resilient.

The Wildfire Factor

Economic disruptions from January’s wildfires in Southern California, primarily in Los Angeles County, were embedded within the broader data but not isolated in the GDP estimate. Preliminary BEA figures estimate that these fires caused $34.0 billion in damage to privately owned fixed assets and $11.0 billion in losses to state and local government infrastructure. While such destruction does not directly affect GDP, it represents a significant loss of wealth.

Looking Ahead

Today’s report is an advance estimate and subject to revision. The second estimate, which will incorporate more complete data, is scheduled for release on May 29, 2025. This will also include preliminary figures on corporate profits, offering additional insight into the underlying economic conditions as the U.S. navigates a complex mix of inflation, investment shifts, and climate-related disruptions.

Disclaimer: This blog post is for informational purposes only and should not be construed as financial advice. Always conduct thorough research and consider seeking advice from a financial professional before making any investment decisions.

Source: https://www.bea.gov/news/2025/gross-domestic-product-1st-quarter-2025-advance-estimate


Start futures forex fx news trading with Haawks G4A low latency machine-readable data, one of the fastest machine-readable news trading feeds for macro-economic and commodity data from the US and Europe.

Please let us know your feedback. If you are interested in timestamps, please send us an email to sales@haawks.com.

Comment

Comment

28 ticks potential profit in 48 seconds on 24 April 2025, analysis on futures news trading natural gas on DOE Natural Gas Storage Report data

According to our analysis natural gas moved 28 ticks on DOE Natural Gas Storage Report data on 24 April 2025.

Natural gas (28 ticks)

Charts are exported from JForex (Dukascopy).


Natural Gas Market Update: Week Ending April 23, 2025

The U.S. natural gas market experienced a broad decline in prices and demand this past week, influenced primarily by unseasonably warm weather and lower residential consumption across key regions. Here's a snapshot of the major trends driving the market, based on data from the U.S. Energy Information Administration (EIA) and S&P Global Commodity Insights.

Price Movements

National Benchmarks:

  • Henry Hub Spot Price dropped by 28 cents, from $3.21/MMBtu to $2.93/MMBtu.

  • May 2025 NYMEX Futures fell by 23 cents, ending at $3.022/MMBtu.

  • The 12-month strip (May 2025–April 2026) averaged $3.756/MMBtu, down 17 cents from the prior week.

Regional Highlights:

  • Northeast prices saw sharp declines due to warming temperatures. Boston’s Algonquin Citygate fell 68 cents to $2.19/MMBtu, while Transco Zone 6 NY dropped 65 cents to $2.08/MMBtu.

  • Waha Hub in the Permian Basin saw the largest regional decline, falling $1.33.

  • Houston Ship Channel stood out with an 11-cent increase.

Weather and Demand Impacts

Temperature swings significantly reduced heating demand in the Northeast:

  • Boston: Avg. temperature rose from 45°F to 56°F, leading to 72 fewer heating degree days.

  • New York (Central Park): Avg. temperature climbed 14°F to 62°F.

This warming trend led to a 51% drop in residential and commercial natural gas consumption in the Northeast, down 4.6 Bcf/d week-over-week.

Supply and Demand Overview

  • Total supply of natural gas fell by 1.0 Bcf/d (0.9%), mainly due to a 16.3% drop in net imports from Canada.

  • Dry gas production remained flat at 106.3 Bcf/d.

  • Total U.S. consumption dropped by 6.3 Bcf/d (8.7%), driven by a:

    • 31.7% decline in residential and commercial use (-6.7 Bcf/d),

    • 2.6% decline in industrial consumption (-0.6 Bcf/d),

    • Slight 3.3% increase in power generation use (+0.9 Bcf/d).

LNG Exports and Pipeline Activity

  • LNG pipeline receipts averaged 16.1 Bcf/d, down 0.7 Bcf/d from the previous week.

    • South Louisiana terminals led the drop, down 6.7% (0.7 Bcf/d).

    • South Texas and other U.S. terminals held steady.

  • 27 LNG vessels departed U.S. ports, carrying a combined 102 Bcf of natural gas.

Rig Activity

  • Natural gas rig count increased by 1 rig to 98.

    • Gains were noted in the Marcellus (+1) and Utica (+2).

    • Two rigs were dropped in unspecified regions.

  • Oil-directed rigs also rose by 1, bringing the total U.S. rig count to 585, still 34 rigs fewer than the same time last year.

Storage Update

  • Net injections into storage totaled 88 Bcf, above both the five-year average (58 Bcf) and last year’s injections (86 Bcf) for this week.

  • Working gas stocks stood at 1,934 Bcf, which is:

    • 2% below the five-year average,

    • 20% below last year’s level at this time.

Key Takeaway:
Warmer weather across the U.S. has significantly reduced natural gas consumption, especially in the Northeast, leading to falling prices and a slight build in storage. While supply has held relatively steady, the combination of reduced imports, softening demand, and flat production paints a picture of a well-supplied market under less pressure—at least for now.

Disclaimer: This blog post is for informational purposes only and should not be construed as financial advice. Always conduct thorough research and consider seeking advice from a financial professional before making any investment decisions.

Source: https://www.eia.gov/naturalgas/weekly/archivenew_ngwu/2025/04_24/


Start futures forex fx commodity news trading with Haawks G4A low latency machine-readable data, one of the fastest data feeds for DOE data.

Please let us know your feedback. If you are interested in timestamps, please send us an email to sales@haawks.com.

Comment